VI User Manual.pdf - 第362页
Reparation 14 - 10 Vision 2007 4.10 User Manu al Rev 01 K Defect status in the repair station (NOT RE PAIRED, REPAIRED, GOOD). L Repair inspection result (Operator analysi s) (in ConfigReparati on.ini file: Enable operat…
Reparation
Vision 2007 4.10 User Manual Rev 01 14 - 9
14.3.2 Reparation detail
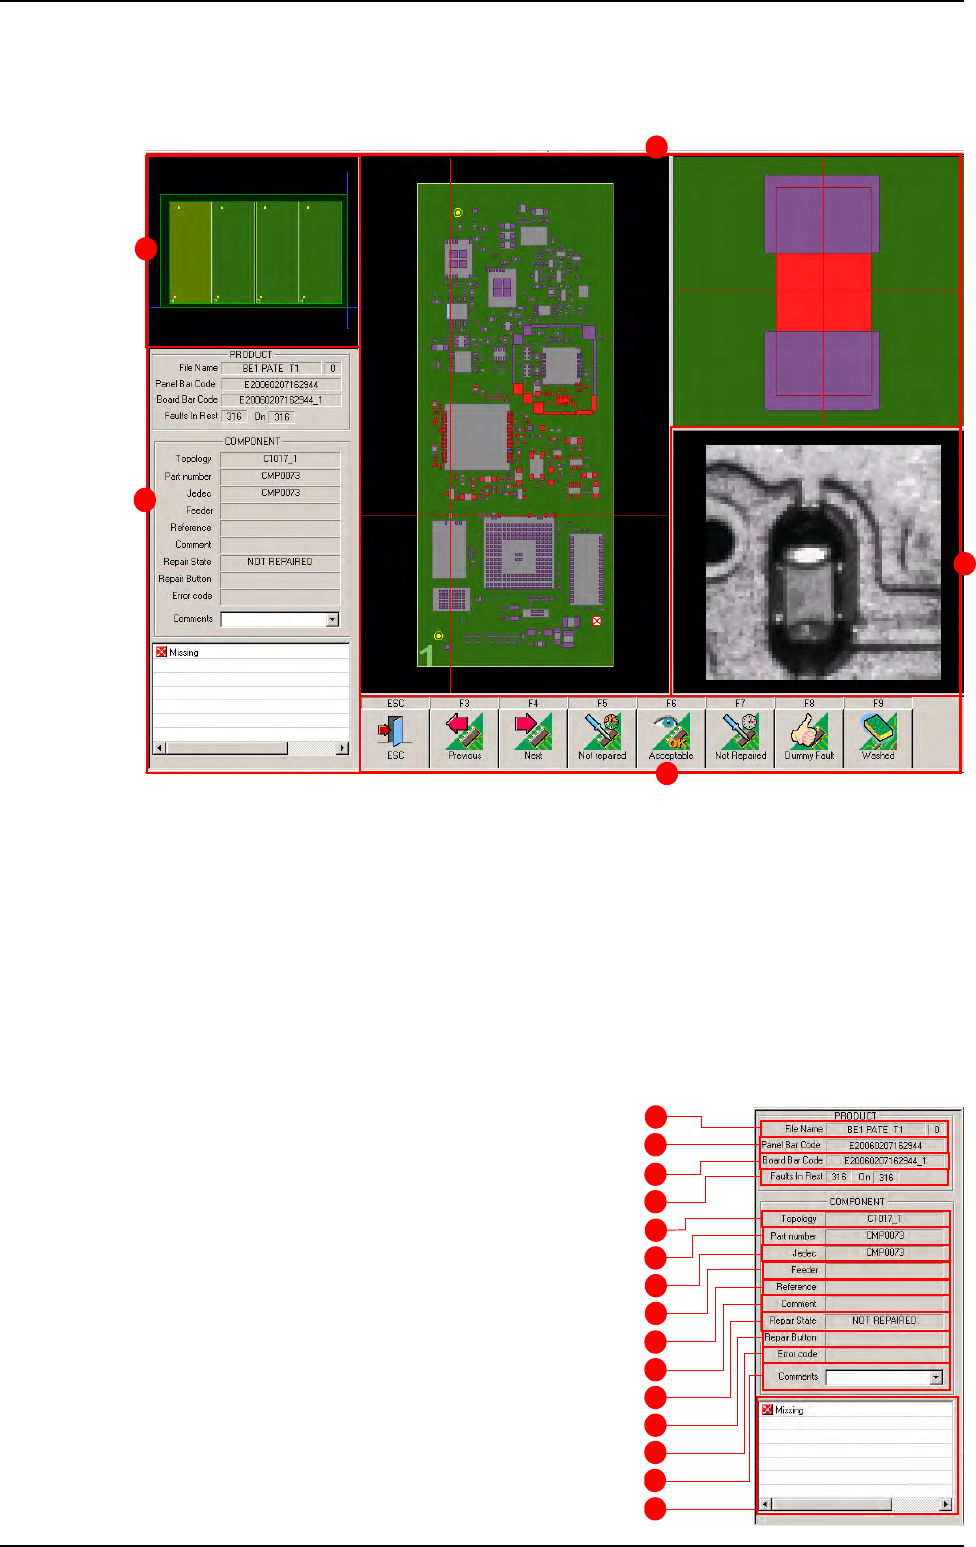
The screen below identifies all the information about the panel. It is divided in 5 main parts:
A Information about the panel and the defect.
B Graphic representation of the panel.
C Graphic representation of the board and the location of the defect. The board on which the
fault was detected is stripped. To access to the defects of any board click on them.
D A picture of the defect taken by the camera.
E The button list for the operator acknowledgement. The F3 and F4 button allows to pass to
the previous or next defect without treating the current one.
14.3.2.1 Panel information
A Test file name.
B Panel bar code of the current defect.
C Board bar code of the current defect.
D Remaining defects to repair.
E Reference designator of the current defect.
F Part number of the current defect.
G Customer name of the current defect.
H Feeder information.
I Reference of the component (coming from
the .Ref file).
J Comment on this component (coming from
the .Ref file).
A
B
C
D
E
F
G
H
I
J
K
L
M
N
O
Reparation use
B
A
E
C
D
Reparation
14 - 10 Vision 2007 4.10 User Manual Rev 01
K Defect status in the repair station (NOT REPAIRED, REPAIRED, GOOD).
L Repair inspection result (Operator analysis) (in ConfigReparation.ini file: Enable
operator analysis (0:1)=1).
M No information.
N List of the comments to be link to the defect.
O List of faults as identified by the inspection system for this component.
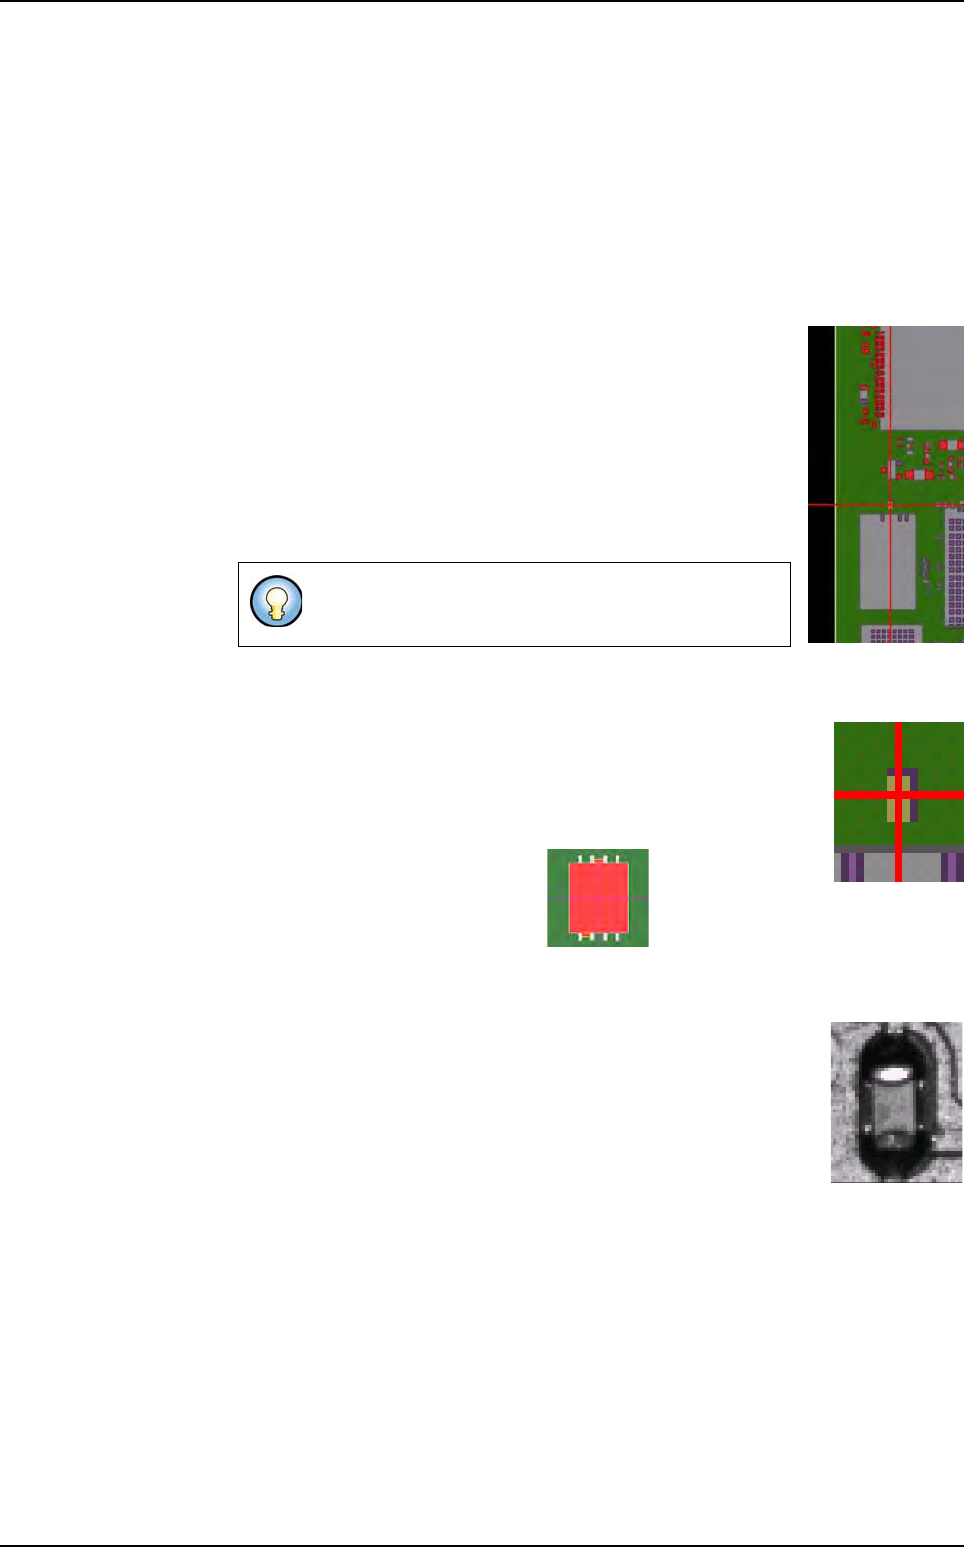
14.3.2.2 Board representation
You can see the graphic representation or the real picture of the
board. If you have a .bmp file of the board (taken with a scan-
ner), you can display it on this screen (see § 14.3.5.2 Display
real images).
All the faulty components appear in RED in the graphic repre-
sentation. Once a component has been repaired, it is in BLUE.
The actual component to repair is marked by the intersection of
2 lines. You can access to each fault by clicking on any compo-
nent.
14.3.2.3 Defect location
On this part you have the precise location of the defect. The actual
component to repair is marked by the intersection of 2 lines and it
is in RED. This part allows you to zoom in and out to see the pre-
cise location of the component on the board.
For SO and QFP components, the precise positions of solder joints
defects and bridges are displaying.
14.3.2.4 Defect picture
During the vision inspection, the camera can save images of the
defects (max. 30 images are saved).
During the reparation, you will have the picture of the defects.
14.3.3 Repairing faults
If you have gone through all the reported faults, but have not acknowledged repairing or at-
tending to all the faults, you will get this message: The whole panel is done. Some com-
ponents are still on fault. Another turn ?
Click YES to return to repairing the faults on this board or click No if you do not want to return
to repairing the faults on this board.
When all the faults have been attended to, you will be advised by this message: All compo-
nents are repaired. Click OK to continue.
Then, after clicking Alt+F4, you accede to the main menu. Here, by clicking Open in Pro-
duction menu, you can take you back to the repair station main screen and load a new .tst
file to repair.
Use the mouse right click to zoom out and the mouse
left click to zoom in.
Reparation use
Reparation
Vision 2007 4.10 User Manual Rev 01 14 - 11
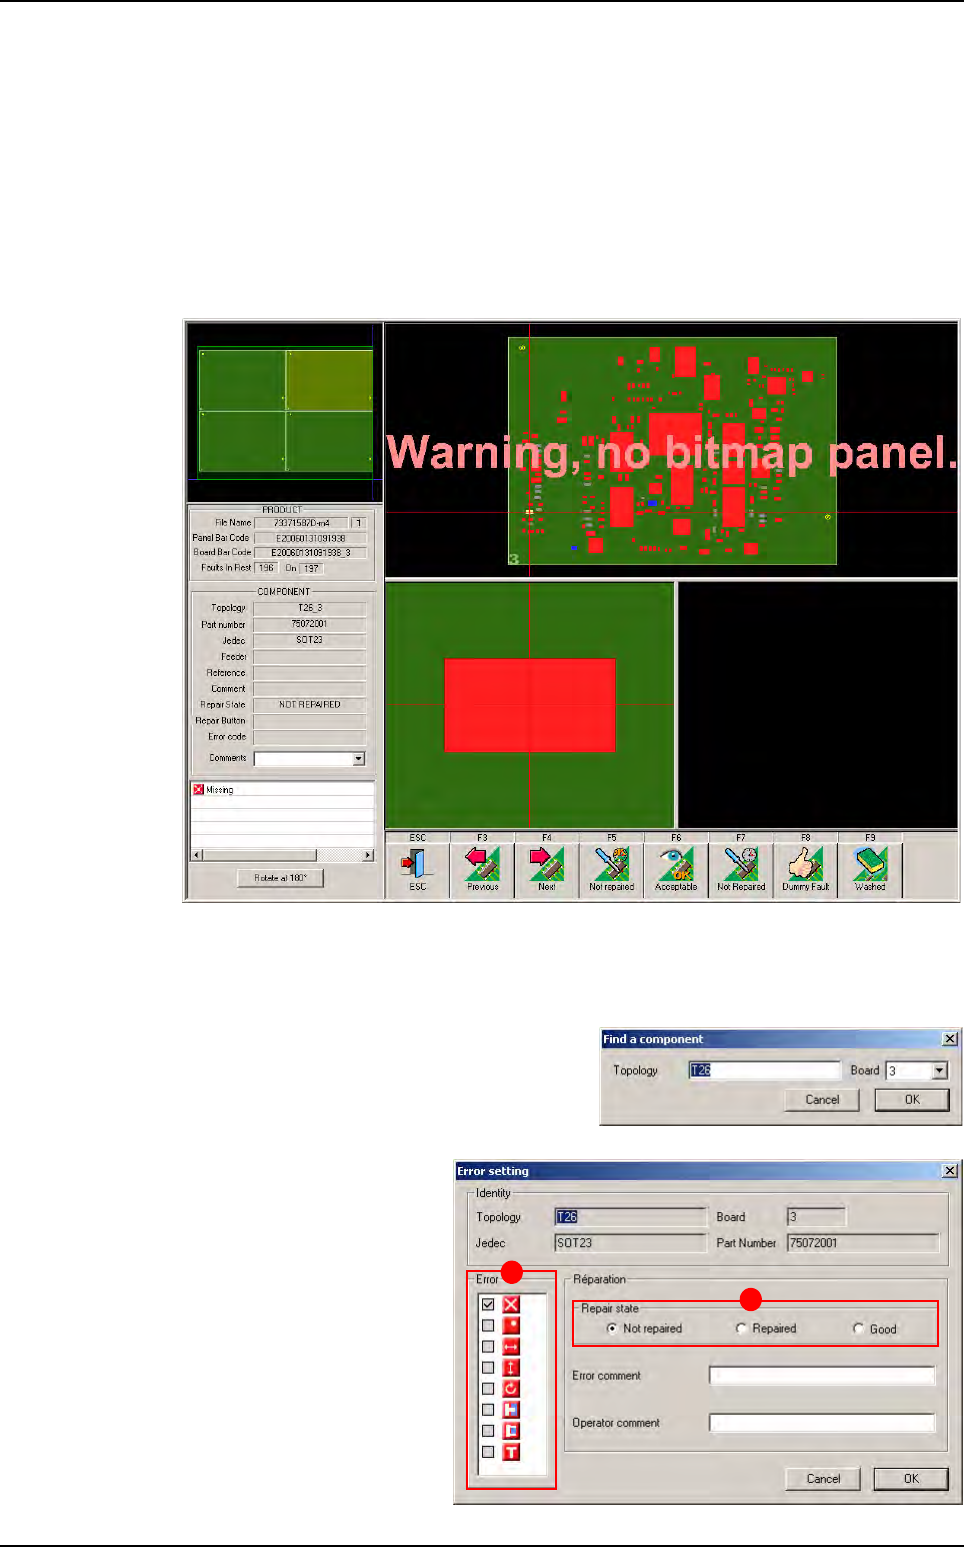
14.3.4 Operator analysis
If after analysis of the reported errors, you judge that errors are not of the good type or that
elements not appearing in error have defects, you can change the type of errors.
Access to this option while putting in the ConfigReparation.ini the parameter Enable oper-
ator analysis (0:1)=1.
Then several actions are necessary:
1. Launch the reparation: the Repair details screen appears. You can analyze and visualize
each component while clicking above.
In the COMPONENT part, the Repair State information (NOT REPAIRED) is displayed.
At the bottom, the type of errors is displayed.
2. Click on Ctrl + A.
The Find a component window appears.
You must define the Topology and the Board
of the element which you wish to analyze.
Click on OK button.
3. The Error setting window of
the analyzed element ap-
pears. You can see the type
of Error (A) and the Repair
state (B): Not repaired.
A
B
Reparation use