3_AVS-V2_MCT-UM-internal_EN_07-2019 - 第119页
ASM AVS - U SER M ANUAL P AGE 119 OF 182 Average of al l values Standard Dev iation Cm Cmk Fas t ev alu ation : gr ee n = c mk ins ide the s pe cif icat ion lim its (S igm a Lim it ins ide S pe c. Lim its ) ) red = c m a…
ASM AVS - USER MANUAL
PAGE 118 OF 182
6. Result area
a. Recipe:
This shows the recipe (measure plan) as an image, which is used in the project.
This is the only tab which is not depending on the filter settings above.
b. Scan:
This view is only active in the printer mode “Single”!
The evaluation is the same as with placement machines.
See also b Scan:
c. Scan 3D:
This view is only active in the printer mode “Single”!
The evaluation is the same as with placement machines.
See also c. Scan 3D:
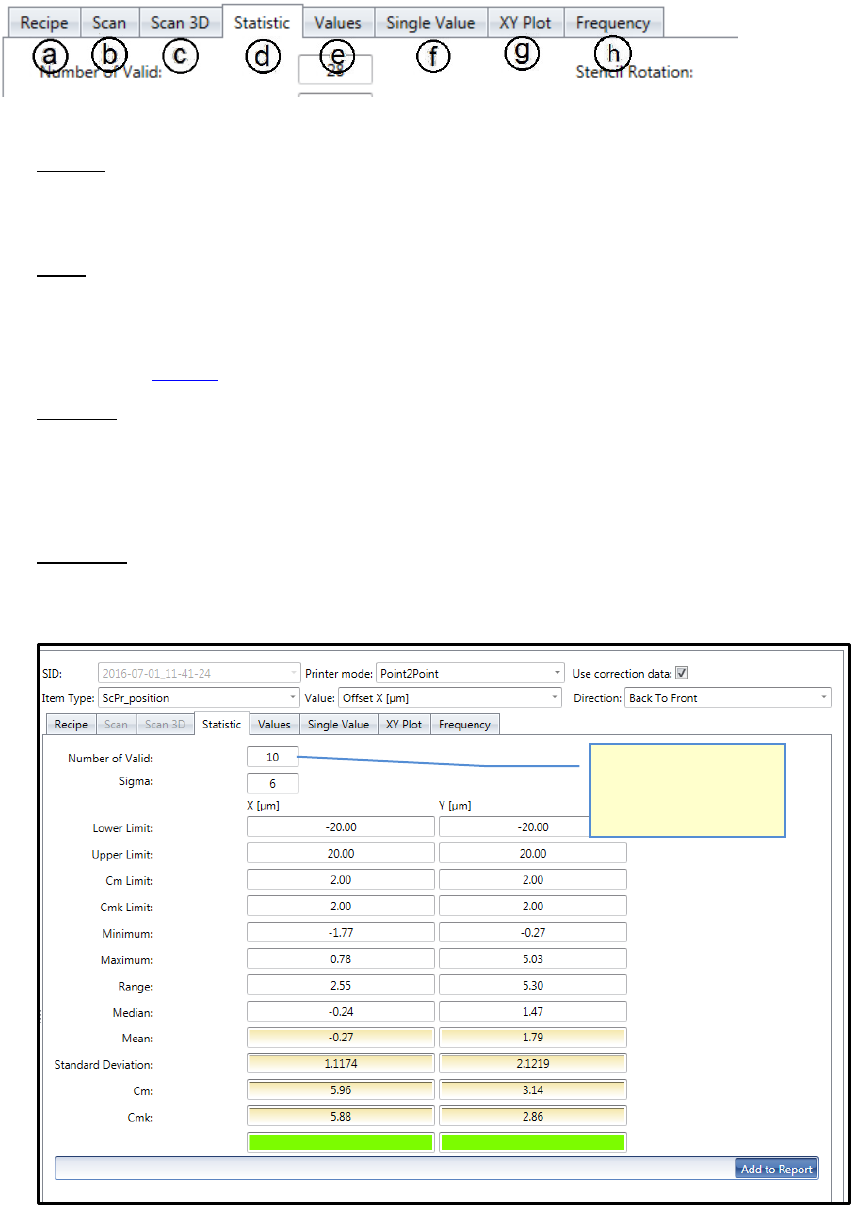
d. Statistics:
Show the mathematical result of the selected measurement(s), depending on the filter
settings above.
The ”number of Valid:”
means the number of
boards in case of
Point2Point mode.
ASM AVS - USER MANUAL
PAGE 119 OF 182
Average of all values
Standard Deviation
Cm
Cmk
Fast evaluation:
green = c
mk
inside the specification limits (Sigm a Limit inside Spec. Limits))
red = c
m
and c
mk
outside the specification limits (Sigma Limit outside Spec. Limits)
yellow = c
m
inside, but c
mk
outside => Offset Correction required.
Please see also 6.4.1 Statistik.
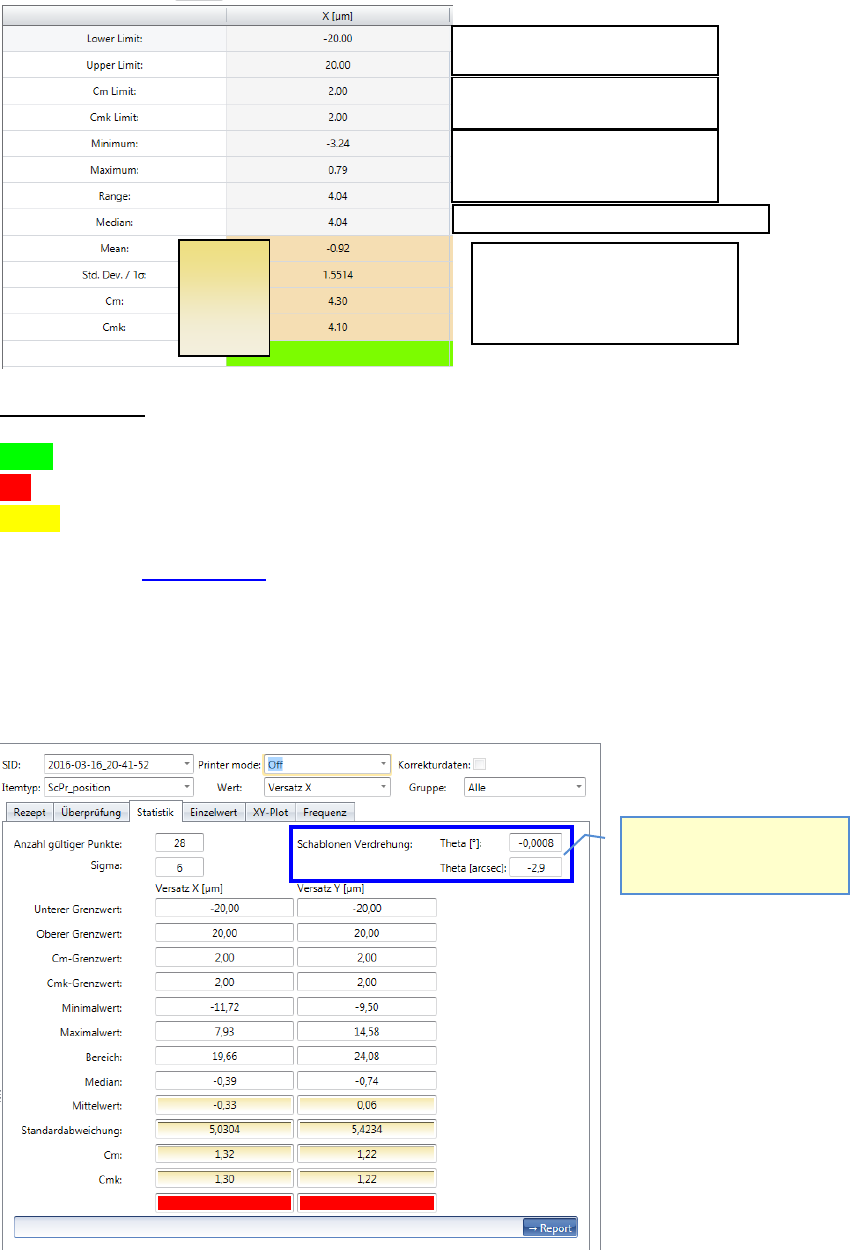
Depending on the "Printer Mode" the measured value for the stencil rotation is displayed
in the "Statistics" on the top right.
Specification limit; dimensions
Specification limit; Sigma Limits
Lowest measured value.
Highest measured value.
Distance min. to max.
Is only shown in printer
mode „Single“ and „Accumu-
late“!
The middle value of all values sorted by size.
Values used
for the
calculation
of the cm,
cmk.
ASM AVS - USER MANUAL
PAGE 120 OF 182
e. Value table:
In this table all measured values are listed in numbers.
This view is only active in the printer mode “Single”!
The evaluation is the same as with placement machines.
See also e. Value table:
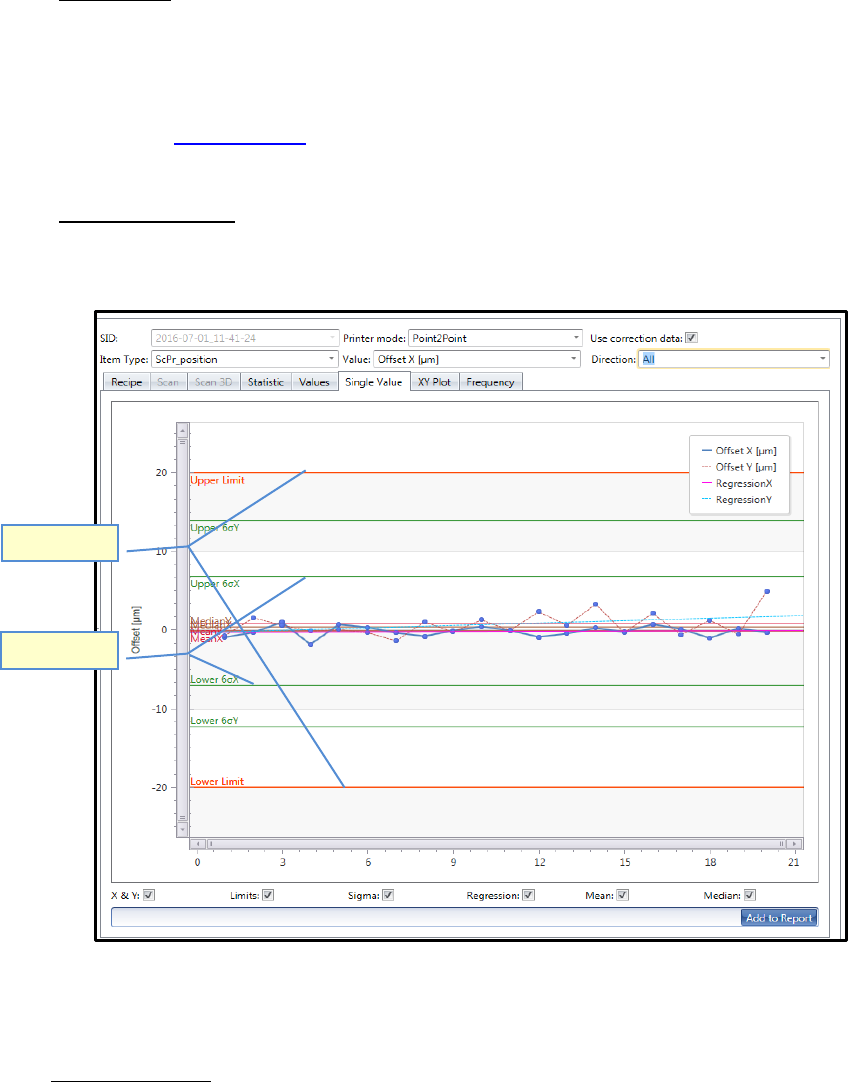
f. Single Value Chart:
a. Zeigt das Ergebnis der selektierten Messung, abhängig von den Filtereinstellungen
oberhalb.
In a printer project, in printer mode „Point2Point“ the Offsets of all the activated
measures are displayed („Board2Board“-view).
Evaluiation lines:
- Sigma limits (green lines) show, at which offset value the given accuracy class (e.g. 6
Sigma) is reached with the present measured values.
In the example above, the accuracy class of 6 Sigma (cmk >2.0) is already reached at the
value +7µm/-7µm in X direction. The specification limits are +/- 20µm (red Line).
- Regression Line shows the offset trend (flowing average) of the result.
- Mean and Median: Both average lines can also be displayed in one diagram. Different to
the regression line, these lines are always straight leveled.
Spec. Limits
Sigma Limits