3_AVS-V2_MCT-UM-internal_EN_07-2019 - 第130页
ASM AVS - U SER M ANUAL P AGE 130 OF 182 5.3.2.7 »Current Results « – »Single value« The ta bles show n in » Sin gle v alue « v iew, are res ult ing from t he set tin gs on the lef t si de o f t he win dow . See a lso 4.…
ASM AVS - USER MANUAL
PAGE 129 OF 182
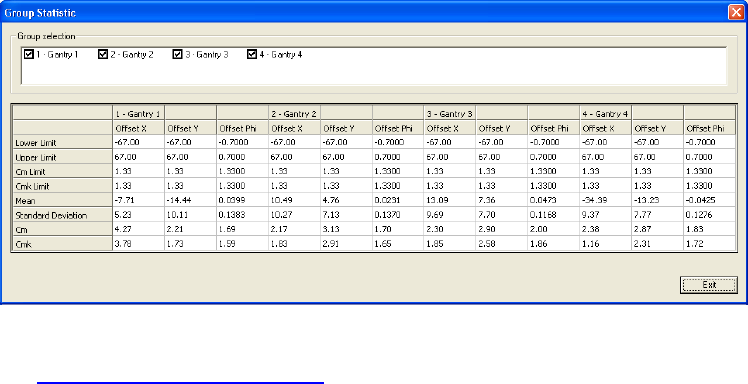
5.3.2.6.1 Group Statistic
The fields of the view »Statistic« are presenting only one result. Therefor only the result of
the overall measurement, or a single item, respectively
a single group can be displayed.
With the function »Group Statistic« all different groups can be displ. at once.
For correction of Offsets on the Siplace machines,
see 6.1 Corrections of Offset values.
ASM AVS - USER MANUAL
PAGE 130 OF 182
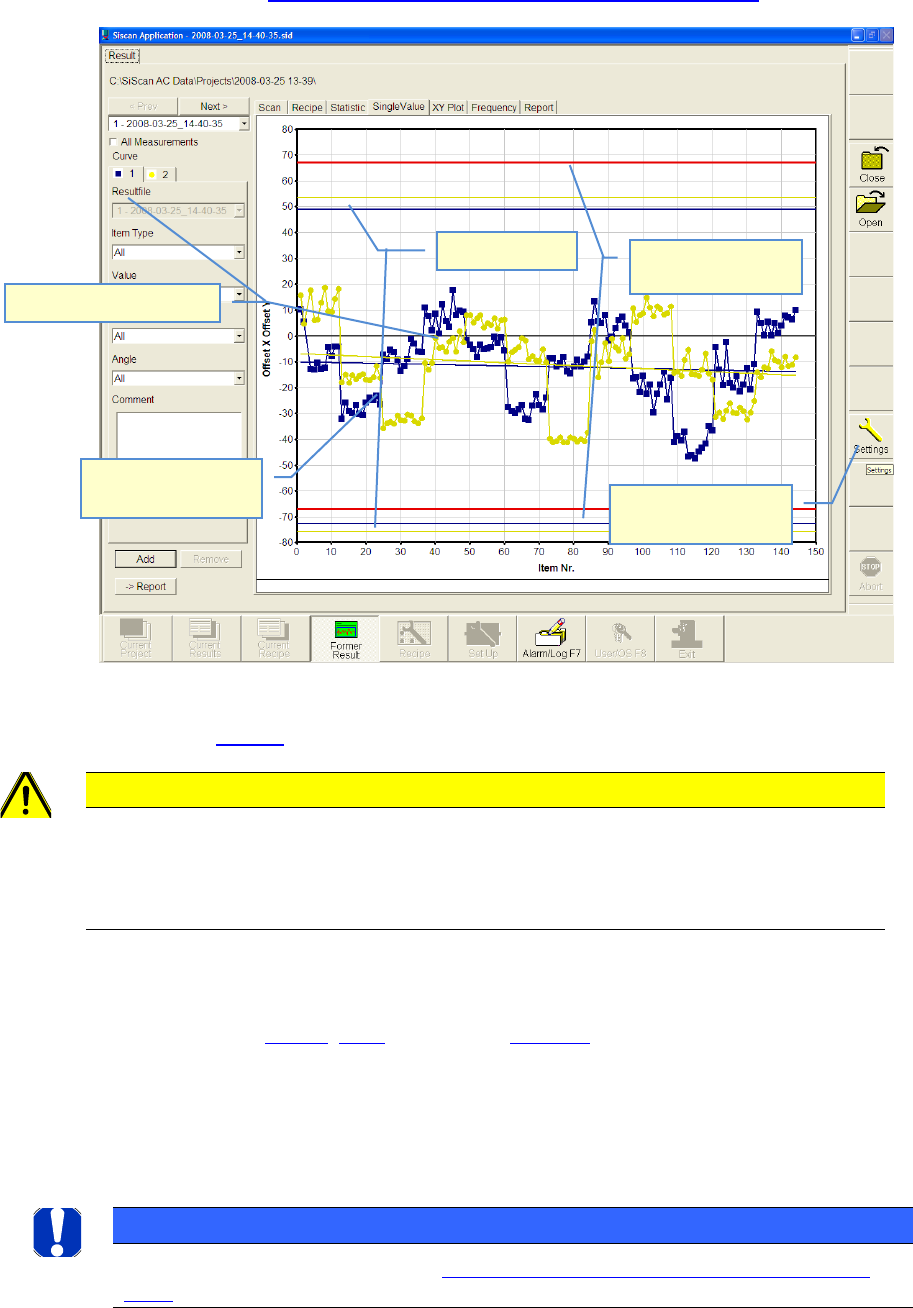
5.3.2.7 »Current Results« – »Single value«
The tables shown in »Single value« view, are resulting from the settings on the left side of the
window. See also 4.3.2.3 »Current Results«, selecting the result display.
Only at the »Single value« view, more than one graph can be displayed in one picture at once.
See therefore 4.3.2.3.
CAUTION
It is not possible to display graphs together which have different specification limits (nominal values). e.g.
X- and Y- axis can not be shown together with the angle graph.
The indication of the specification limits is hanging on the “Item”.
Therefore it is possible to evaluate different “Items” with different spec. limits.
Sigma limits show, at which offset value the given accuracy class will be achieved by the actual
result.
Accuracy Class, see 4.3.2.6, 4.3.1, respectively 4.2.6.1.2
In the example above, in the minus direction, the required 4 Sigma (cmk=1,33) is only achieved
at approx. -73µm for the X-axis (blue graph), as well as at approx. -77µm for the Y-axis (yellow
graph). But the required specification limit is, however, 67µm (red line).
Regression lines show the mean value trend of the result.
NOTICE
More details about reading the results, see 6.4 Notes on the statistics and on the interpretation of the
results.
Graph 1, e.g. X Offset.
Regression line
(Trend)
Sigma limit
Specification limits
(Nominal value)
Support lines can be
turned on/off .
ASM AVS - USER MANUAL
PAGE 131 OF 182
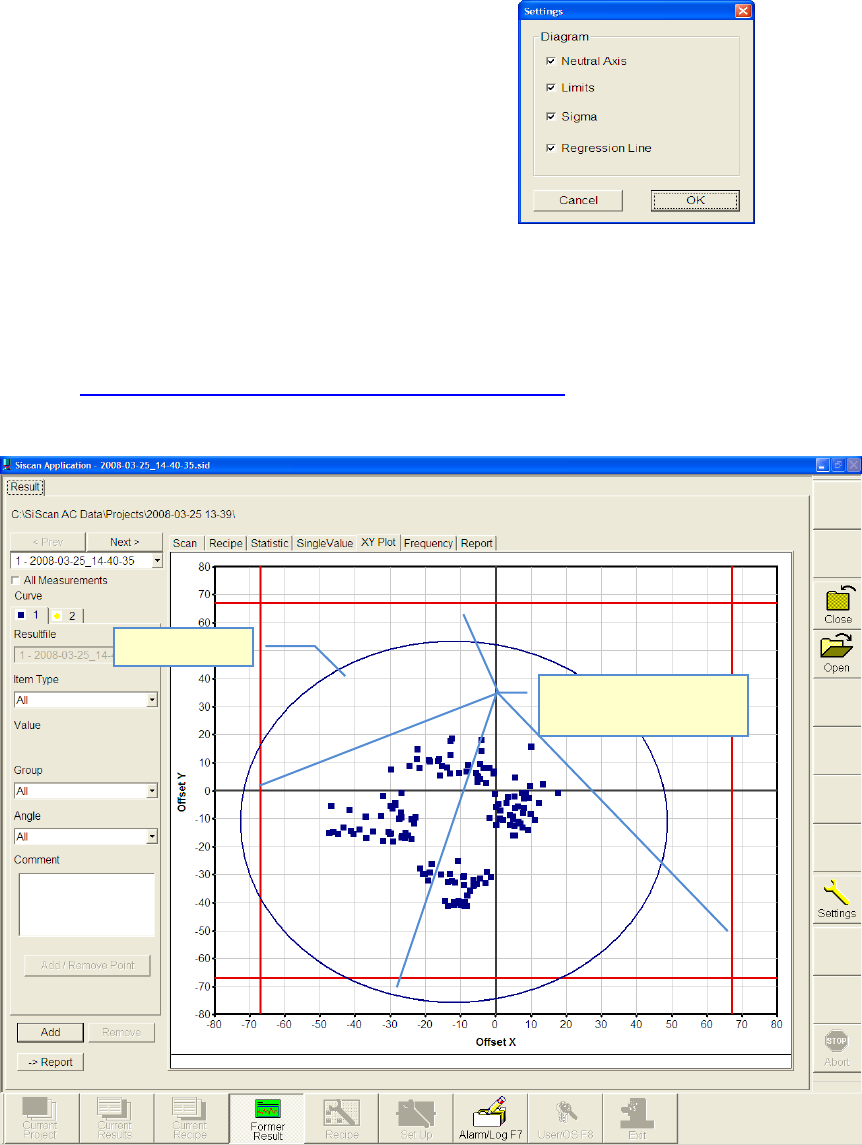
5.3.2.7.1 Settings
With settings it is possible to turn on and off the
support lines for the graphical view
This is available for all graphs except
the regression line. The regression line
is only available at single value graph.
5.3.2.8 »Current Results« – »X-Y-Plot«
The tables shown in »X-Y-Plot« view, are resulting from the settings on the left side of the
window
See also 4.3.2.3 »Current Results«, selecting the result display
This view shows the result of X- and Y-axis together in one graph
The same principles apply for evaluating the chart and in respect of the meanings of the auxil-
iary lines as for the "Single Value Chart".
Sigma limit
Specification limits (Nom-
inal value)