3_AVS-V2_MCT-UM-internal_EN_07-2019 - 第133页
ASM AVS - U SER M ANUAL P AGE 133 OF 182 5.3.2.10 »Current Results« – »Report«: In thi s win dow all resu lts are lis ted w hic h are se lected to be a p art o f t he final ce rtif icate (re port ) . Thi s li st will be …
ASM AVS - USER MANUAL
PAGE 132 OF 182
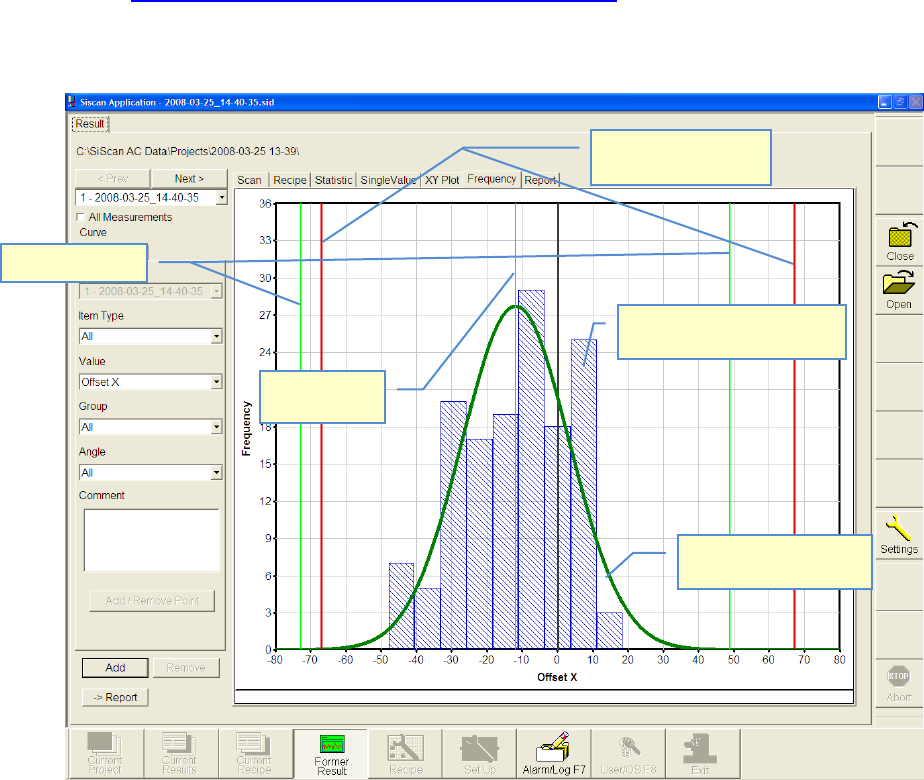
5.3.2.9 »Current Results« – »Frequency«
The tables shown in »Frequency« view, are resulting from the settings on the left side of the
window
See also 4.3.2.3 »Current Results«, selecting the result display
With the view of »Frequency« the »bell-shaped curve« (normal distribution) can be shown.
(Gauss)
As a fundamental principle:
• The narrower and higher the bell curve, the better the result.
• The curve should ideally be centered on zero.
The same principles apply in respect of the meanings of the auxiliary lines as for the "Single
Value Chart".
Sigma limits
Bell-shaped curve
(Normal distribution)
Specification limits
(Nominal value)
Numbers measuring points
(here in 10µm steps)
Mean value
(Mean)
ASM AVS - USER MANUAL
PAGE 133 OF 182
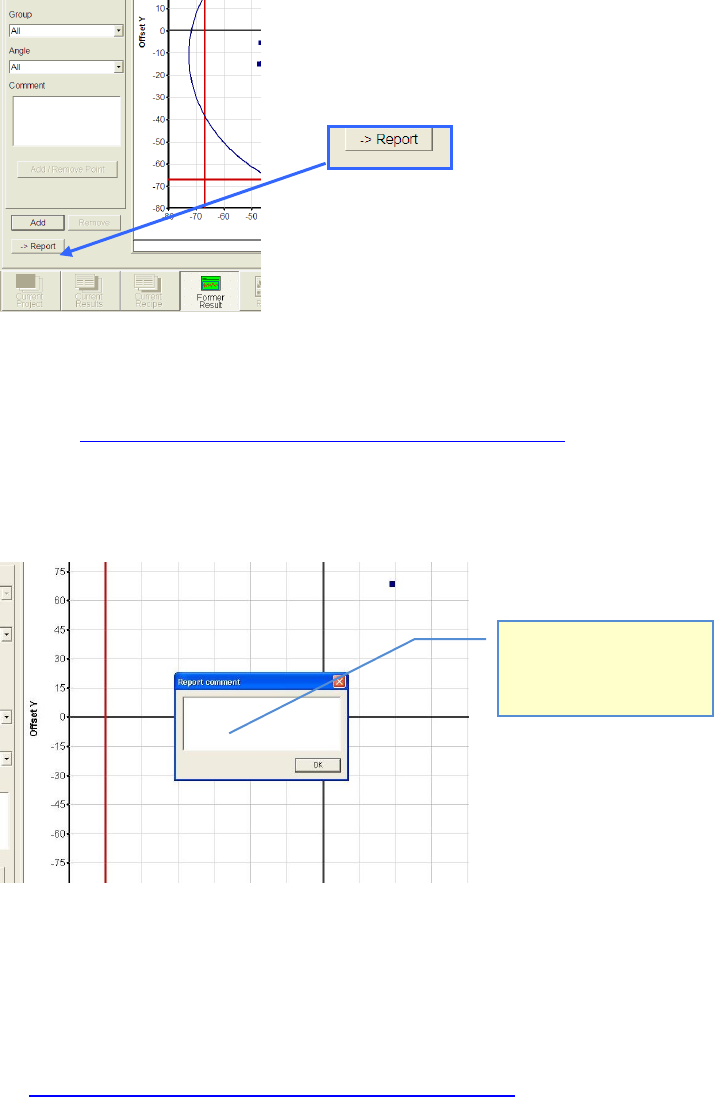
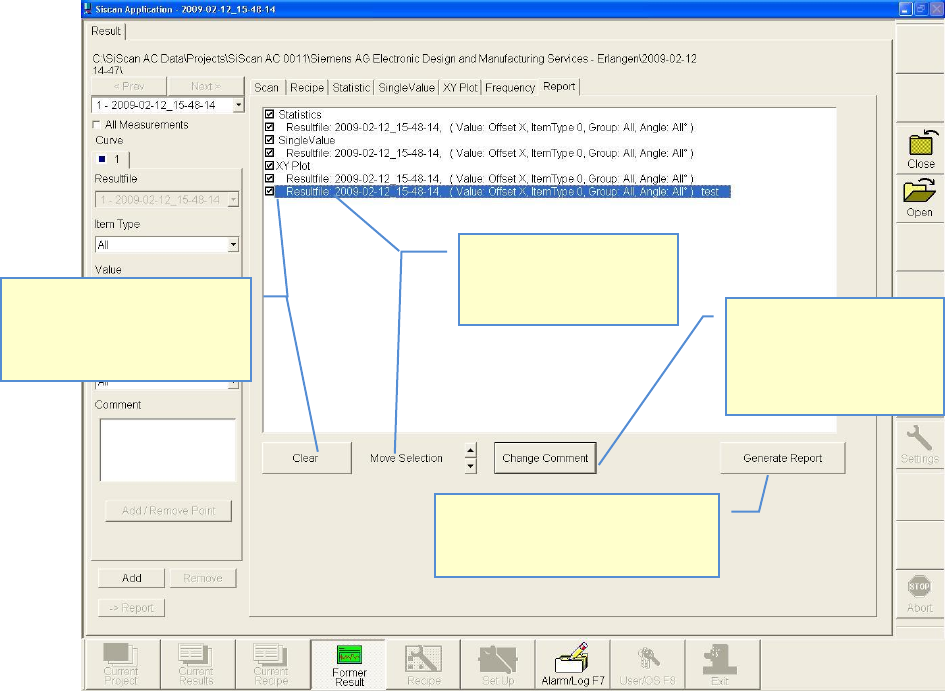
5.3.2.10 »Current Results« – »Report«:
In this window all results are listed which are selected to be a part of the final
certificate (report).
This list will be created and filled by pushing the »→ Report« Button.
In each partial view where this button is active the shown result can be added to the report.
See also 4.3.2.3 »Current Results«, selecting the result display
After Click on the » → Report« Button, a dialog to to insert the comment, appears.
This comment is going to be placed, directly after the selected table or graph.
Specials:
• If you choose only one group, instead of “All Groups” in the »Statistic« view, because, e.g.,
you like to see the result of one single head, out of a placement from four heads (see
4.3.2.3 »Current Results«, selecting the result display) then, a special design is going to be
used in the report.
Some parts of the standard statistic view will be obsolet then.
Hier können Sie zur ausge-
wählten Tabelle, bzw.
Grafik, einen Kommentar
hinzufügen.
ASM AVS - USER MANUAL
PAGE 134 OF 182
1. Highlight row (blue)
2. Highlighted rows can be
moved with the arrow
buttons.
1. Select (deselect) entry with
check box
2. All selected entrys can be
deleted by the Clear-Button
Certificate will be generated as an
Adobe Acrobat PDF-File and must be
saved in the project path.
1. Highlight row (blue)
2. Clicking the button
“Change Comment”, the
comment to the graph or
the table can be changed.