3_AVS-V2_MCT-UM-internal_EN_07-2019 - 第173页
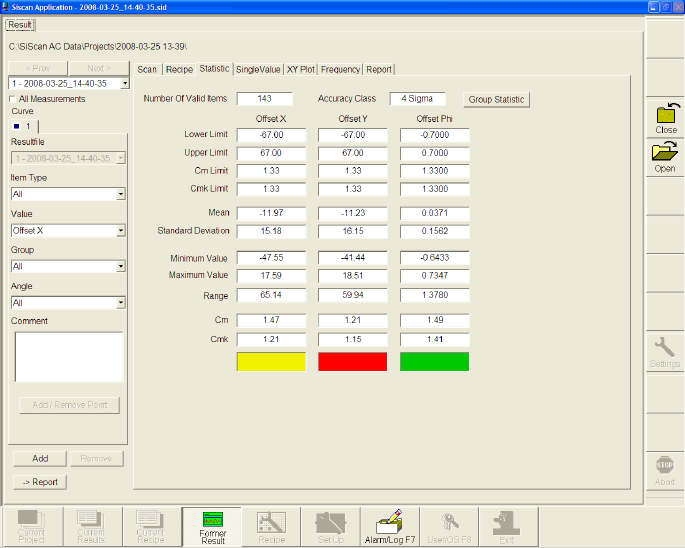
ASM AVS - U SER M ANUAL P AGE 173 OF 182 • Mi nim um Va lue, Maxim um Value , R ange The ra nge i s t he d iffer ence be tween the min im um and max imum valu es m easu red. • C m, C mk Ma chine ca pabil ity a naly ses d…
ASM AVS - USER MANUAL
PAGE 172 OF 182
7.4 Notes on the statistics and on the interpretation of the results
7.4.1 Statistics
7.4.1.1 Statistical values
• Mean
Arithmetic mean of all the measured offsets.
• Standard deviation
The standard deviation or variance specifies the degree to which a random variable is distrib-
uted around the expected value.
The expected value is zero, as the expectation is that the machine works perfectly, i.e. with-
out any offset.
The value given in the view corresponds to the standard deviation with reference to 1σ (sig-
ma).
This means that if the result is to be evaluated with reference to the nominal values, the val-
ue must be multiplied by the sigma value of the nominal value (in the specification).
In the example above: Standard deviation for X axis = 15.18 µm => with reference to the
nominal values 15.18 *4 = 60.72 µm.
Therefore, to remain within the tolerance laid down in the specification of ±67 µm, a maxi-
mum deviation of the mean of all measured points of 6.28 µm is permitted.
ASM AVS - USER MANUAL
PAGE 173 OF 182
• Minimum Value, Maximum Value, Range
The range is the difference between the minimum and maximum values measured.
• Cm, Cmk
Machine capability analyses document the capability of a manufacturing device (place-
ment machine) to complete a specified processing task (placement of components at the
nominal position) reliably over the long term.
The Cm and Cmk values are the machine capability indices.
The machine capability index Cm is calculated as the quotient of the specification limit and
six times the standard deviation:
s
TlTu
Cm
*6
−
=
A machine capability index of Cm = 1.0 means that 99.73 % of all measured values lie with-
in tolerance. A value of Cm = 2.0 means that 99.9999998 % of all measured values lie with-
in tolerance.
The Cmk value also takes into account any systematic shift of all placement coordinates or
of the normal Gaussian distribution around a so-called mean (mean, x) in addition to the
standard deviation.
s
TlxxTu
Cmk
*3
),min( −−
=
Example:
c
m
<1,33
c
mk
<1,33
c
m
<1,33
c
mk
<1,33
c
m
>1,33
c
mk
<1,33
c
m
>1,33 c
mk
>1,33
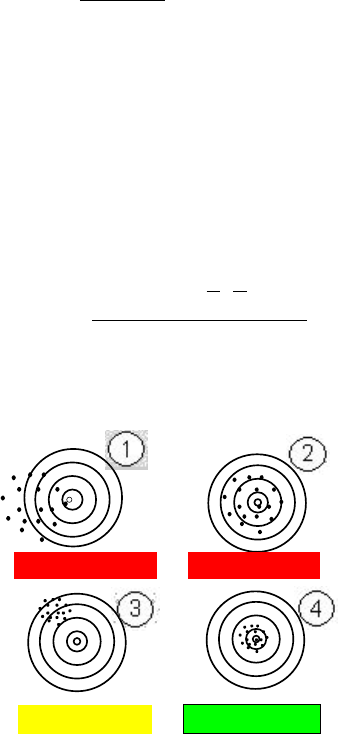
The figure on the left illustrates the significance
of the capability indices using hits on a shooting
target.
Target 1: Distribution of the individual values is
too large => Cm value < nominal.
A global offset of the individual values can also
be observed.
Target 2: Distribution of the individual values is
too large => Cm value > nominal. Although
there is only a small global offset, the large
distribution means that the specification cannot
be met.
If the Cm value is < nominal, the Cmk value can
also never be > nominal!
Target 3: Distribution of the individual values is
low. => Cm value > nominal.
The global offset, however, means that the Cmk
< nomianal. The specification is not met here
either.
Target 4: Distribution is low and the global
offset is minimal. => Cm value > nominal and
Cmk value > nominal. The specification was
therefore met.
The table below shows the relationships between the sigma values, the hit rate, the Cm and
Cmk values and the defect rate (dpm).
Tu = Upper tolerance threshold
Tl = Lower tolerance threshold
s = Standard deviation (at 1 sigma)
ASM AVS - USER MANUAL
PAGE 174 OF 182
The sigma value that is used by default when making specifications for SIPLACE placement
machines is highlighted in green in the table.
The table shows that a value of 4 sigma corresponds to a hit rate of 99.994%, a Cmk value of
1.33, and a dpm rate of 60.
Sigma
Hit rate
Cm; Cmk
Defect rate (dpm)
1
68.27 %
0.33
317300
2
95.45 %
0.66
45500
3
99.73 %
1
2700
4
99.994 %
1.33
60
5
99.99994 %
1.66
0.6
6
99.9999998 %
2.00
0.002
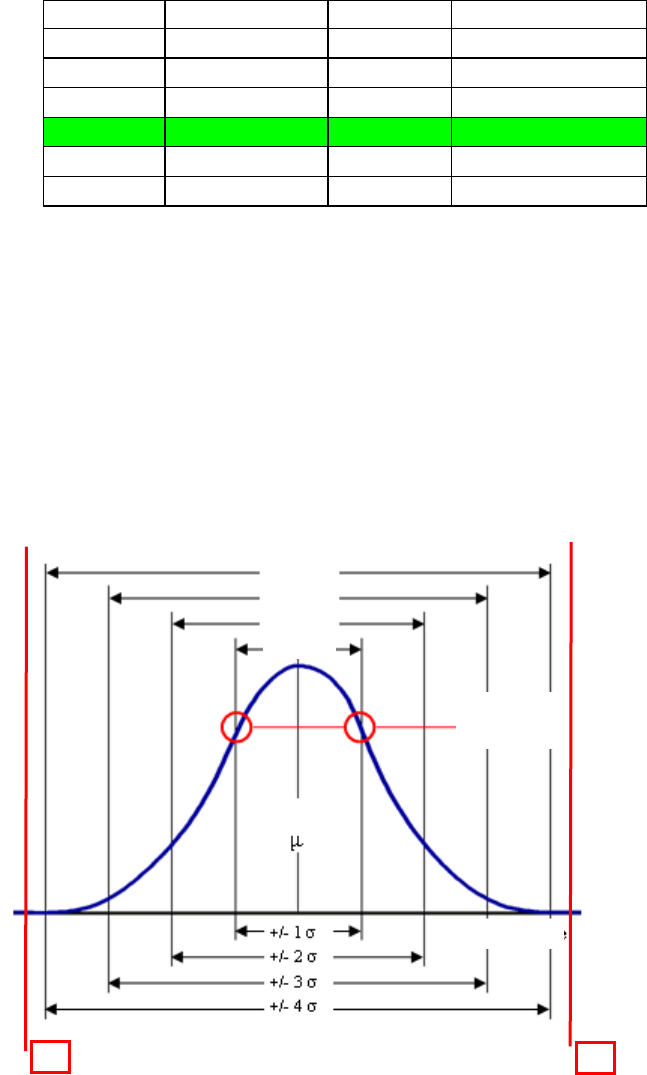
• Normal distribution, Gaussian bell curve
The diagram below shows a normal Gaussian distribution (bell curve). It illustrates the def-
inition of 1 sigma.
1 sigma lies precisely at the inflection point of the bell curve.
This means that 68.26 % of the area beneath the bell is covered, i.e. the hit rate is only
68.26 %.
If you now continue to add the same distance in both directions, you arrive at 2, 3, 4 sigma
etc. and the hit rate increases correspondingly.
Tl
Mean value
Measured values
Inflection
points
99.994 %
99.73 %
95.44 %
68.26%
Tu