3_AVS-V2_MCT-UM-internal_EN_07-2019 - 第92页
ASM AVS - U SER M ANUAL P AGE 92 OF 182 De tails to the are a (3 ) „R esu lt A r e a“ a. Reci pe: Show s t he r ecipe (mea surin g pl an), w hat is m easu red in the projec t, as a n im age . Thi s is the onl y t ab, w h…
ASM AVS - USER MANUAL
PAGE 91 OF 182
Details to the area (2) „Filter for measurement“
a. SID - Measurement: If you select more than one measurement in the list on the left
hand side, you can then select the measurement you like to see in the tabs bellow, at
this point.
b. Item type: If your recipe consists of more than one Item type, you can change here
between the different types for analysis. Usually you need more than one Item type
for a recipe, if different specifications need to be measured.
c. Value: You can switch between X, Y and phi, for views in the tabs, which can only
show one axis.
d. Group: If your recipe consists of more than one group (e.g. different gantries), you can
switch between the groups here.
e. Angle: The most recipes have placement plans with changing angles of 0°, 90°, 180°,
270°.
These angles can be seen as a group and you can filter your result below regarding this
angle group!
f. Accumulate: If this button is activated, all the measurements selected in the list on
the left side are calculated and presented all together. E.g. if a measurement has 100
measurement points and 3 measurements are selected, the analysis view shows the
result of 300 measurement points all together.
NOTICE
All changes in this area are effecting all different tabs down under!
NOTICE
If more than one measurement is activated, in the “Single Value” tab all measurements are shown togeth-
er, each in the color as allocated in the list beside.
ASM AVS - USER MANUAL
PAGE 92 OF 182
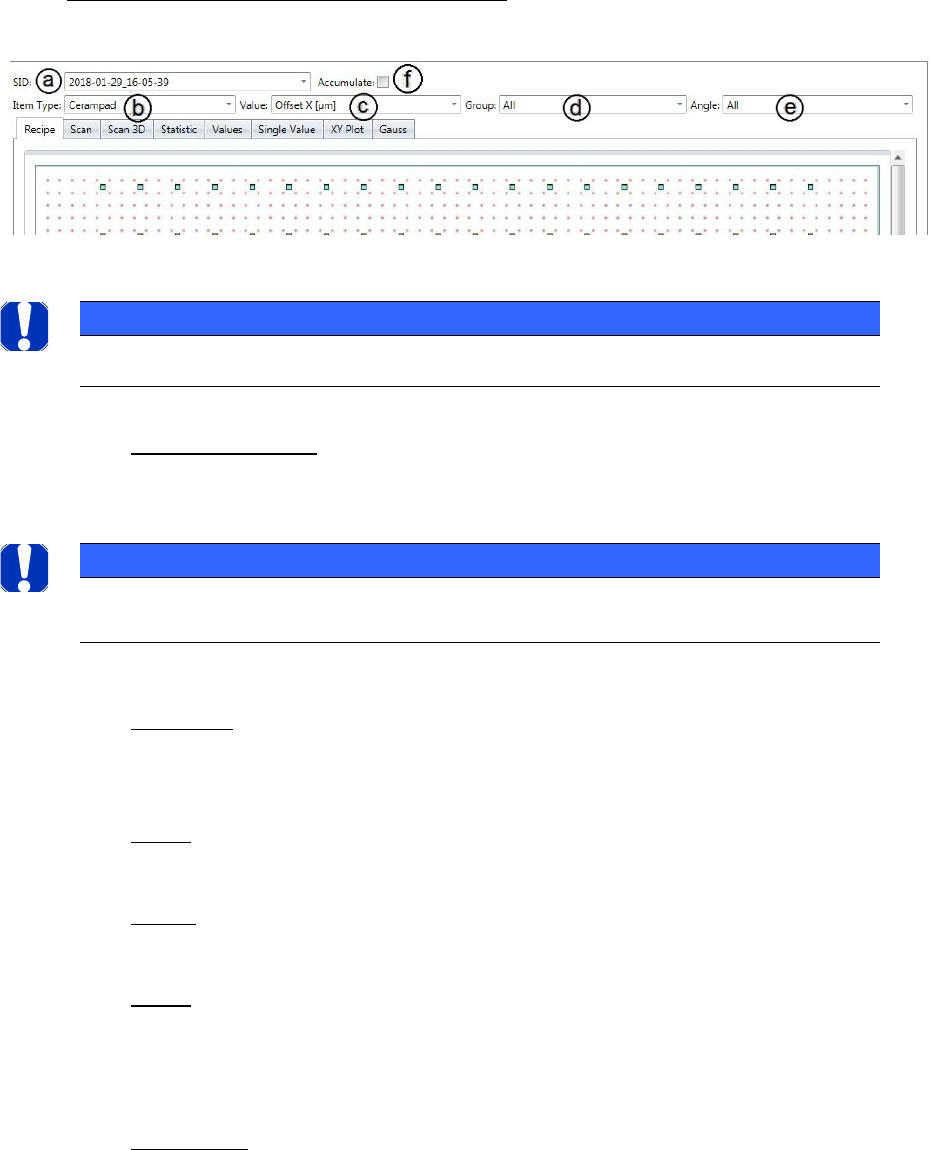
Details to the area (3) „Result Area“
a. Recipe:
Shows the recipe (measuring plan), what is measured in the project, as an image.
This is the only tab, which does not depend on the filter settings above.
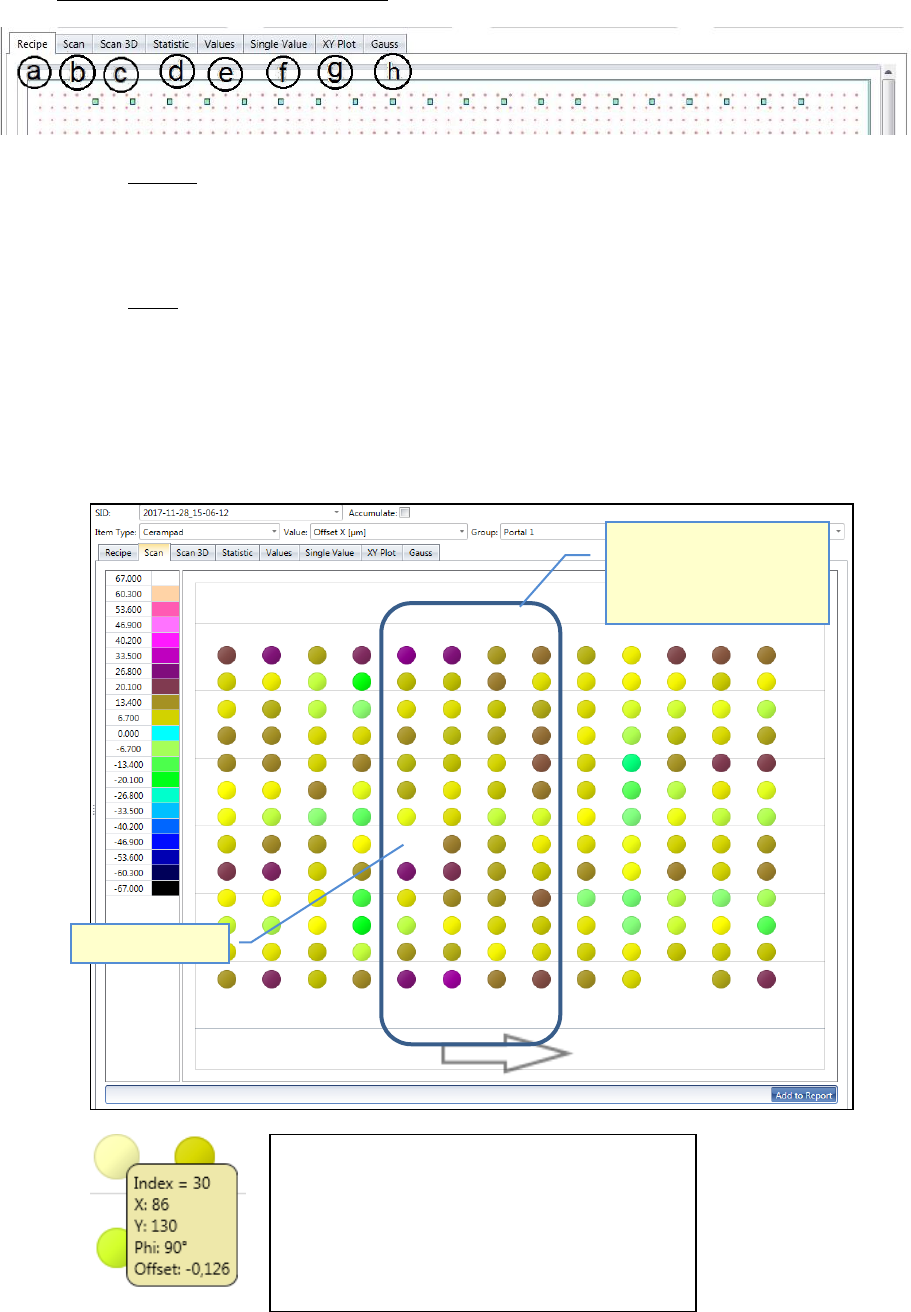
b. Scan:
Here, a colored circle is shown for each measurement point, as a kind of color map.
The color represents the size of the offset values, from the axis which was selected via
the filter settings above. The colors are broken down in a legend on the left.
It is a view from the top onto the glass plate. Thus the placement error (offset) can be
analyzed by the gradient, over the entire surface.
Missing Placement!
With this view, peaks,
placement faults and trends
can be localized on the glass
plate.
If you move the mouse over one dot, following
information will be shown in a yellow rectangle:
- Index: position number (measuring sequence)
- X: Specified value (Position on the plate)
- Y: Specified value (Position on the plate)
- Phi: Specified value (Position on the plate)
- Offset: measured offset from the specified…
ASM AVS - USER MANUAL
PAGE 93 OF 182
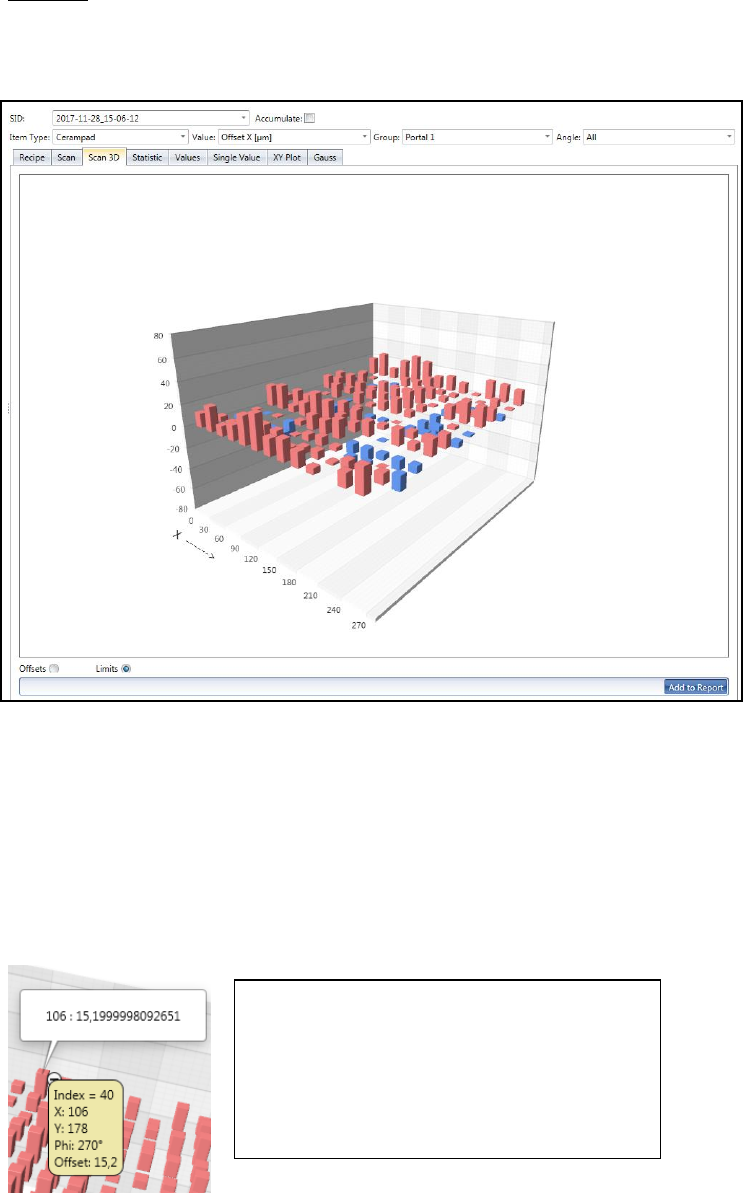
c. Scan 3D:
Similar to the view "Scan" this is about the analysis of the result on the surface and
thus the spatial variation of the error.
The offset values are displayed on bars.
Brick Red bars go up and show the positive offset values.
Blue bars go down and show the negative offset values.
You can turn the chart in all directions by clicking and holding the left mouse button
(cursor has hand form).
With the mouse wheel you can zoom the image in or out.
With the radio buttons "Offsets" vs. "Limits" you can switch the scaling.
For "Offsets", the respective "Min." and "Max." values form the limits of the graphic.
For "Limits" the graph is limited by the values of the specification.
If you move the mouse over one bar, following
information will be shown in a yellow rectangle:
- Index: position number (measuring sequence)
- X: Specified value (Position on the plate)
- Y: Specified value (Position on the plate)
- Phi: Specified value (Position on the plate)
- Offset: measured offset from the specified…
-