3_AVS-V2_MCT-UM-internal_EN_07-2019 - 第94页
ASM AVS - U SER M ANUAL P AGE 94 OF 182 d. S tat istic : Show s t he r esul t of the sele cte d me asurem ent de pendin g o n the Fil te r set ting s abo ve. Fas t res ult eva luat ion: gre en = c mk with in nom inal val…
ASM AVS - USER MANUAL
PAGE 93 OF 182
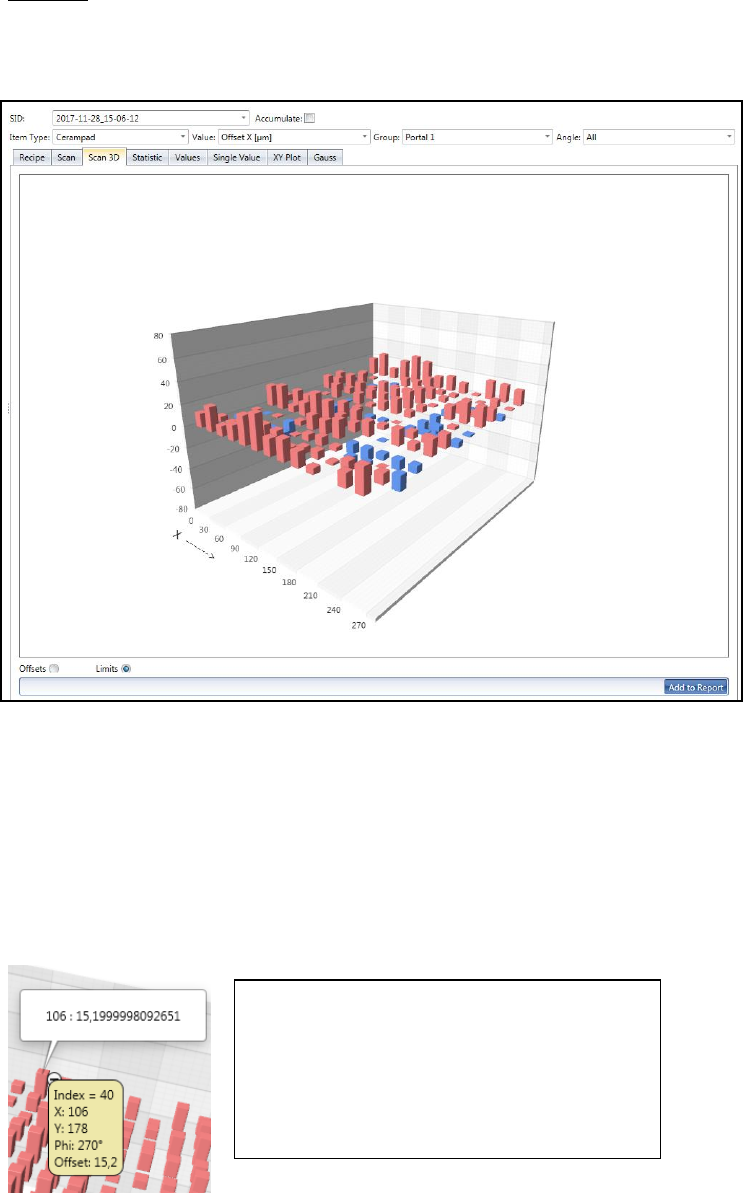
c. Scan 3D:
Similar to the view "Scan" this is about the analysis of the result on the surface and
thus the spatial variation of the error.
The offset values are displayed on bars.
Brick Red bars go up and show the positive offset values.
Blue bars go down and show the negative offset values.
You can turn the chart in all directions by clicking and holding the left mouse button
(cursor has hand form).
With the mouse wheel you can zoom the image in or out.
With the radio buttons "Offsets" vs. "Limits" you can switch the scaling.
For "Offsets", the respective "Min." and "Max." values form the limits of the graphic.
For "Limits" the graph is limited by the values of the specification.
If you move the mouse over one bar, following
information will be shown in a yellow rectangle:
- Index: position number (measuring sequence)
- X: Specified value (Position on the plate)
- Y: Specified value (Position on the plate)
- Phi: Specified value (Position on the plate)
- Offset: measured offset from the specified…
-
ASM AVS - USER MANUAL
PAGE 94 OF 182
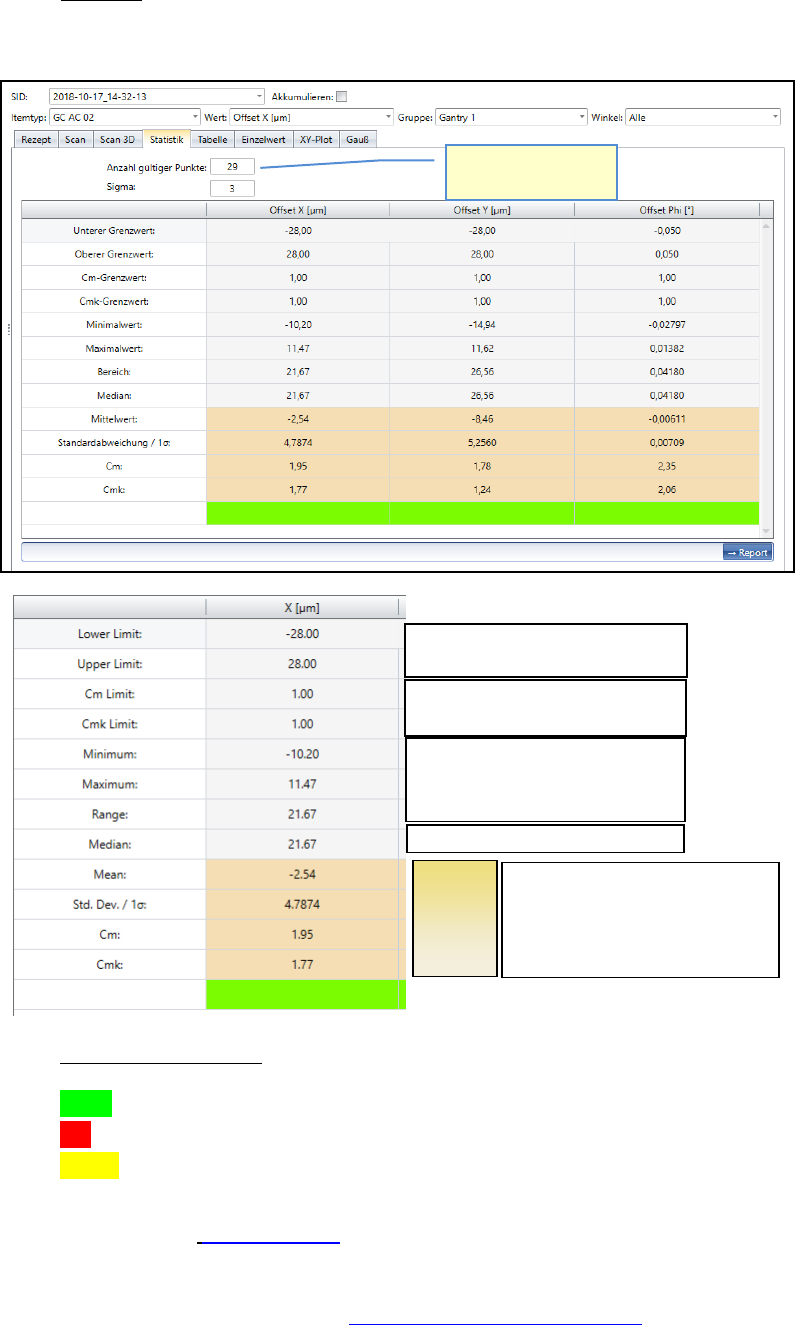
d. Statistic:
Shows the result of the selected measurement depending on the Filter settings above.
Fast result evaluation:
green = c
mk
within nominal value
red = c
m
and c
mk
out of nominal value
yellow = c
m
within, but c
mk
out of nominal value. => Offset correction is necessary
Please see also 6.4.1 Statistics.
The offset can be adjusted to approximate the Cmk value to the Cm value.
How to adjust the offsets? See 6.1 Corrections of Offset values.
Spec. Limits, Dimensions
Spec. Limits, Sigma value
Lowest measured value (min.)
Highest measured value (max.)
Distanz min. to max.
The middle of all values sorted by size.
Factors,
which are
important
for the
result, are
highlighted
Number of values in
the calculation.
Average of all values
Standard Deviation
Cm
Cmk
ASM AVS - USER MANUAL
PAGE 95 OF 182
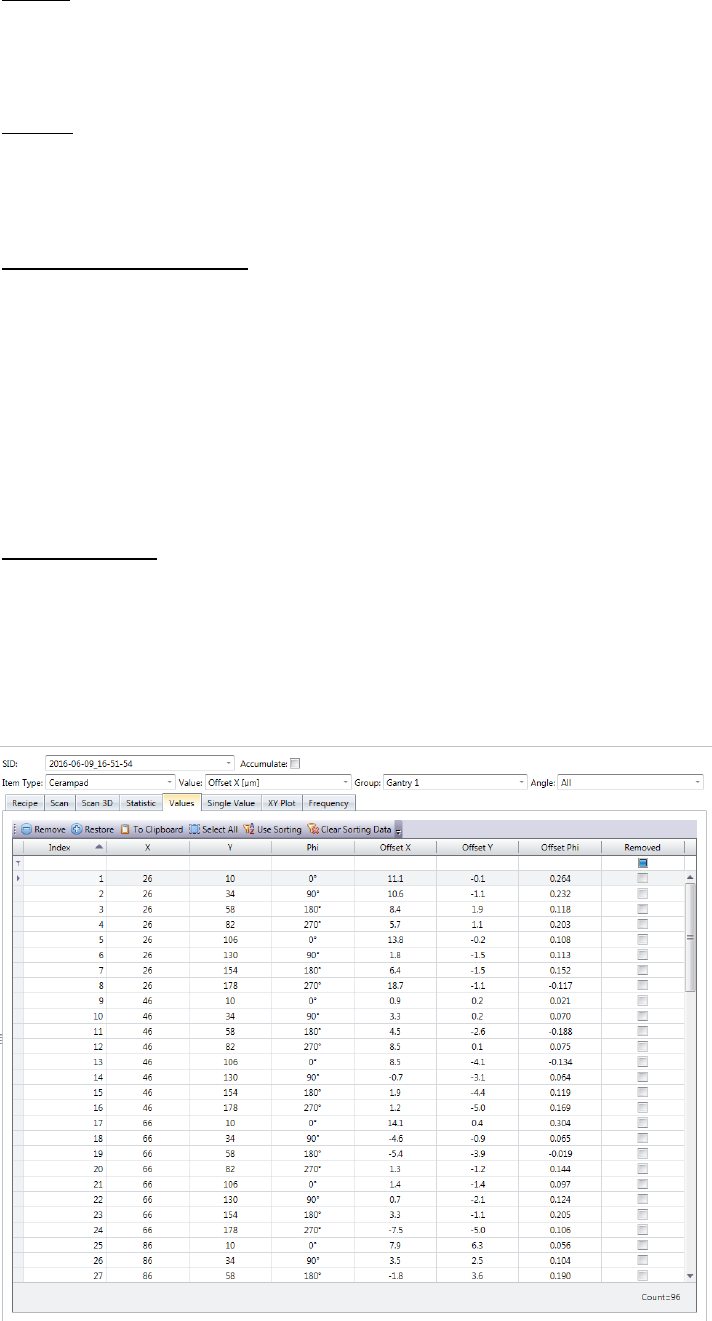
e. Values:
This view shows a table with all the values that go into the calculation, or into the
drawing of the graphics.
Sorting:
Since the nominal values of the measuring points are listed in this table, it is also pos-
sible to reorder the measurement result.
Press the button "Use Sorting" show the graphic "single value" in this sequence.
Omit measurement points:
When troubleshooting, it is sometimes helpful to omit individual values, thus taking it
out of the calculation. This is especially helpful on printing projects, to remove
smeared points from the result.
Highlight the line of the appropriate measuring value (in blue) and click on the button
"Remove". The checkbox in the „Removed” column indicates whether a measurement
point was omitted.
To add the measured value into the result again, highlight the corr. sine and click on
the button "Restore".
Exporting Result:
Using this table, the result can be transmit to an Excel sheet. Highlight either all rows
that you want export, or click "Select All" to the entire table.
Then press the button "To Clipboard".
You can then paste these values to the Excel table, or even to a normal text editor
from the clipboard.