3_AVS-V2_MCT-UM-internal_EN_07-2019 - 第97页
ASM AVS - U SER M ANUAL P AGE 97 OF 182 On the bot tom o f t he c hart , yo u ca n ac tiv ate o r de activ ate a ll t he ev alu atio n line s. - I f y ou wa nt t o see e ithe r X -O ffse t va lues or Y -Off set va lue s …
ASM AVS - USER MANUAL
PAGE 96 OF 182
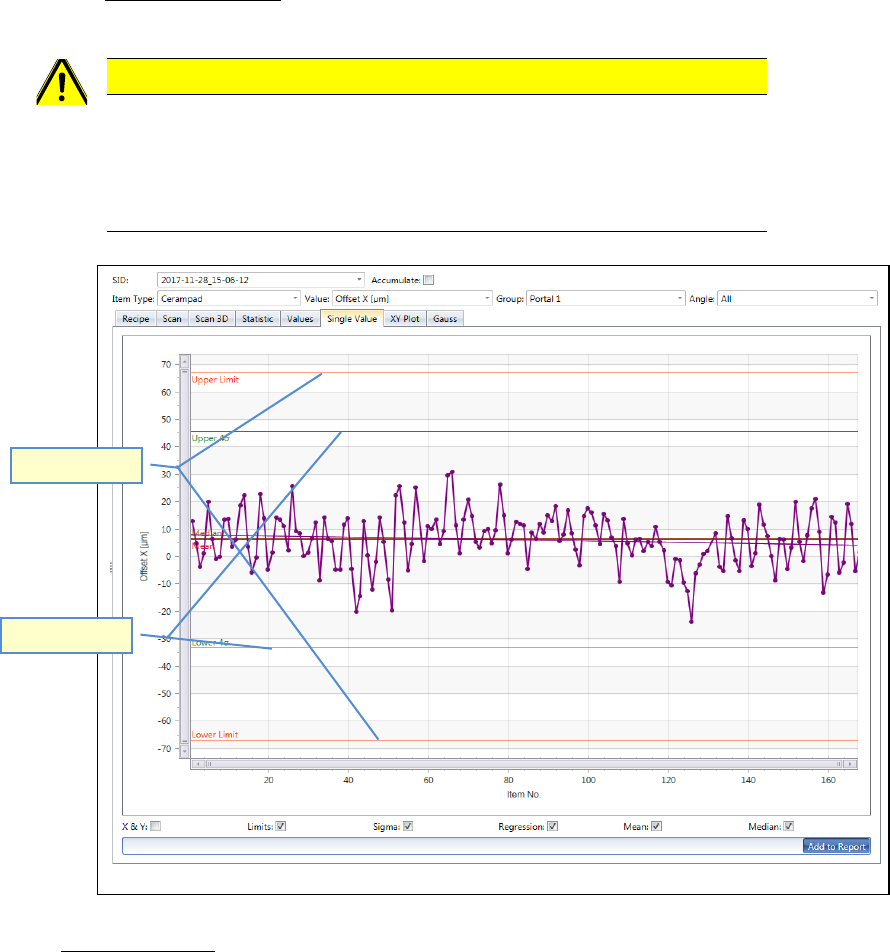
f. Single Value Chart:
Shows the result of the selected measurement depending on the Filter settings above.
CAUTION
It is not possible to display graphs together which have different specification limits
(nominal values). e.g. X- and Y- axis cannot be shown together with the angle graph.
The indication of the specification limits is hanging on the “Item”.
Therefore, it is possible to evaluate different “Items” with different spec. limits.
Evaluation lines:
- Sigma limits (green) show, at which offset value the given accuracy class (e.g. 4 Sigma)
will be achieved by the actual result.
In the example above, the required 4 Sigma (cmk=1,33) is already achieved at approx. -
+45µm and -35µm for the X-axis (green line).
The specification limits are at +/- 67µm (red line)
- Regression lines (same color as Values): show the mean value trend (floating average)
of the result.
- Mean and Median (same color as Values): both average values can be displayed as a
line in the graph, too. Different to the floating regression line, these are always straight.
Spec. Limits
Sigma Limit
ASM AVS - USER MANUAL
PAGE 97 OF 182
On the bottom of the chart, you can activate or deactivate all the evaluation lines.
- If you want to see either X-Offset values or Y-Offset values is organized by the filter set-
tings on top of the graph.
But if you want to see both, X- and Y- Offsets in one picture, you need to activate the
checkbox “X & Y” on the bottom of the graph.
The Y-Offset then is always shown in the same color, but in dashed line.
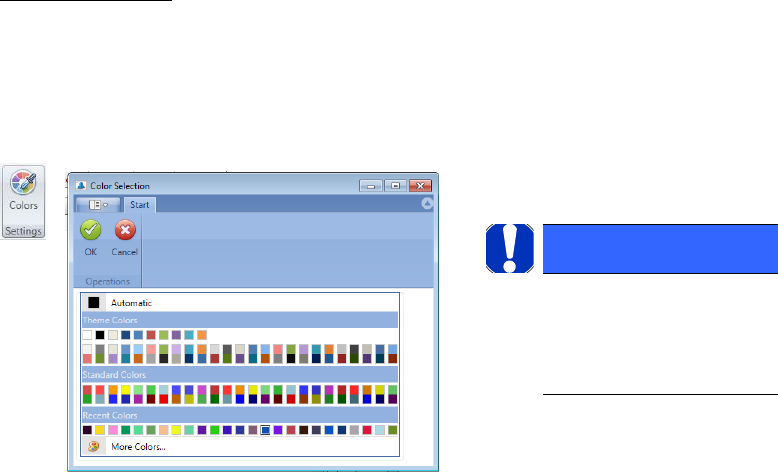
Set color of graph:
The color for the graph is normally set automatically for each measurement.
But you can change the color for each measurement.
Highlight the line of the corresponding measurement in the table and press “Colors” in the
menue bar.
NOTICE
After changing the color you
need to refresh the view, e.g.
by changing to the Recipe tab
and back to Analysis.
ASM AVS - USER MANUAL
PAGE 98 OF 182
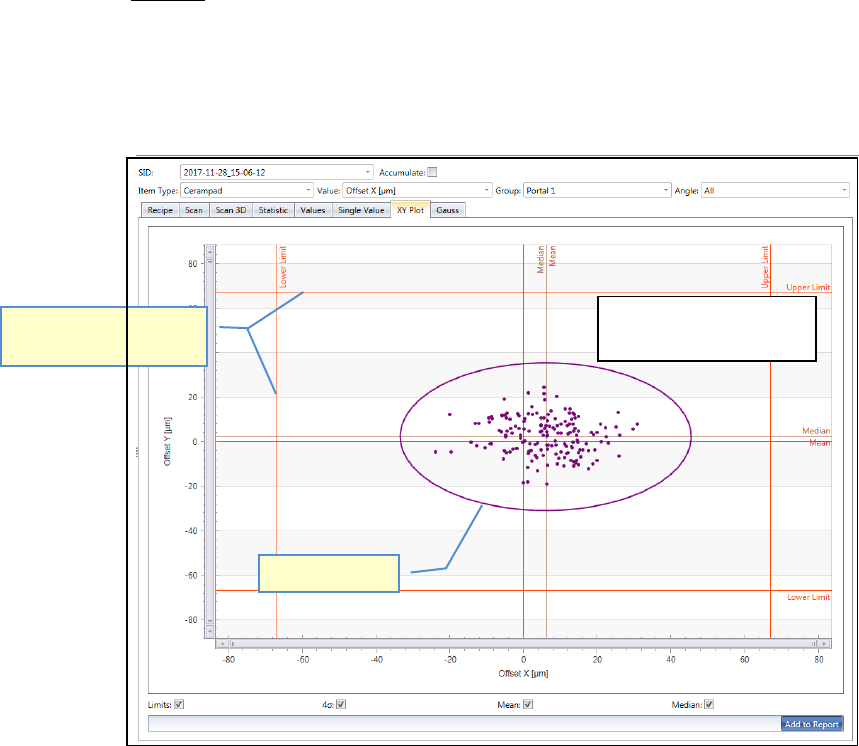
g. XY-Plot:
Shows the result of the selected measurement depending on the Filter settings above.
This view shows the result of X- and Y-axis together in one graph.
The same principles apply for evaluating the chart and in respect of the meanings of
the auxiliary lines as for the "Single Value Chart".
Sigma limit
Specification limits (Nom-
inal value), red lines
The Sigma Limit is shown
in a circle (ellipsis).