3_AVS-V2_MCT-UM-internal_EN_07-2019 - 第99页
ASM AVS - U SER M ANUAL P AGE 99 OF 182 h. G auss ( bell curv e): Show s t he r esul t of the sele cte d me asurem ent d ependi ng on t he Filte r set ti ngs a bove . Wit h t he vie w o f »Fre quenc y« t he »bel l-s hape…
ASM AVS - USER MANUAL
PAGE 98 OF 182
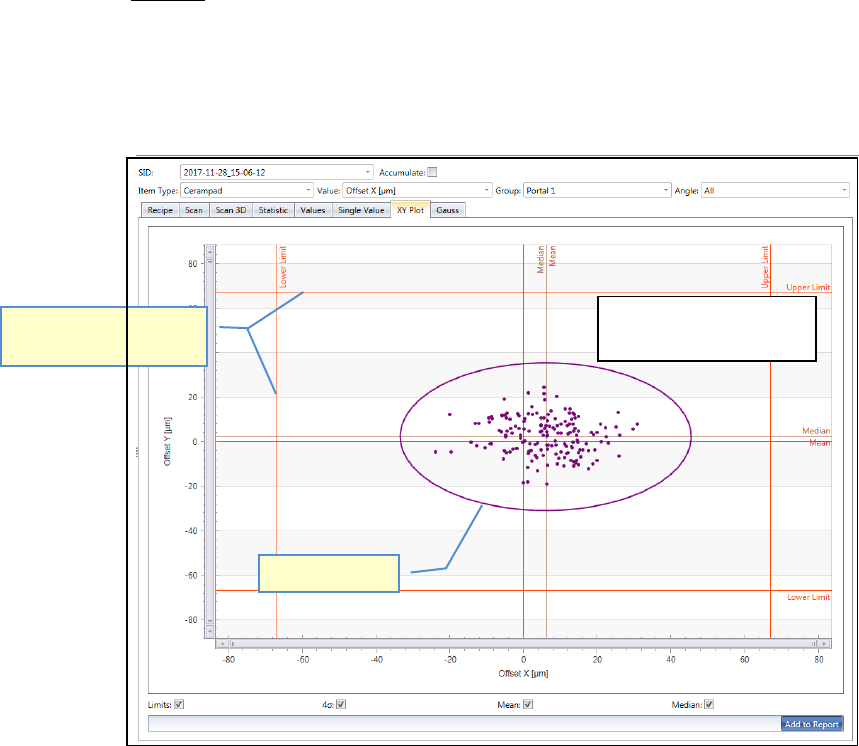
g. XY-Plot:
Shows the result of the selected measurement depending on the Filter settings above.
This view shows the result of X- and Y-axis together in one graph.
The same principles apply for evaluating the chart and in respect of the meanings of
the auxiliary lines as for the "Single Value Chart".
Sigma limit
Specification limits (Nom-
inal value), red lines
The Sigma Limit is shown
in a circle (ellipsis).
ASM AVS - USER MANUAL
PAGE 99 OF 182
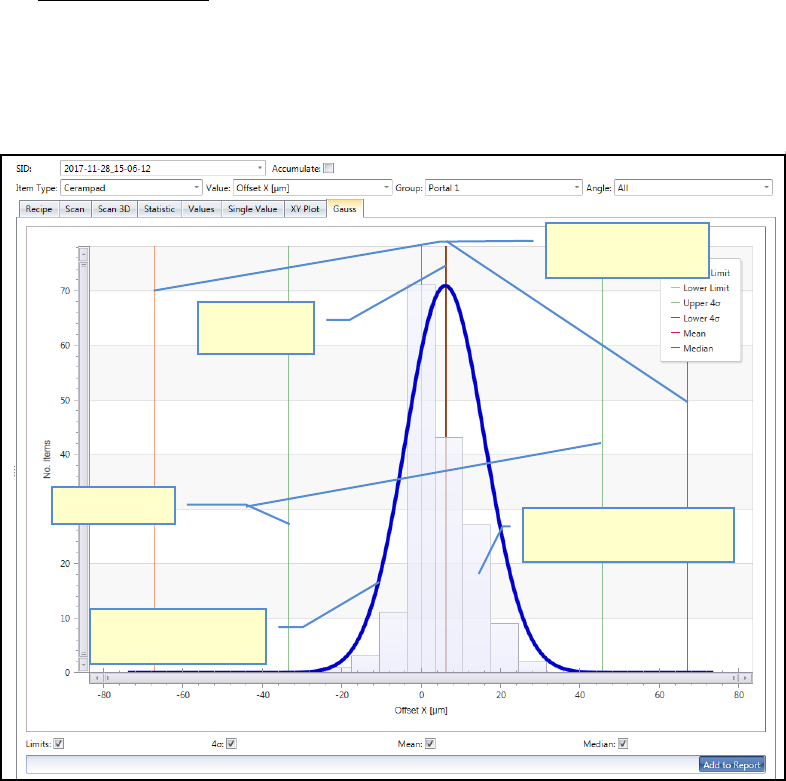
h. Gauss (bell curve):
Shows the result of the selected measurement depending on the Filter settings above.
With the view of »Frequency« the »bell-shaped curve« (normal distribution) can be
shown (Gauss). The same principles apply for evaluating the chart and in respect of
the meanings of the auxiliary lines as for the "Single Value Chart".
As a fundamental principle:
• The narrower and higher the bell curve, the better the result.
• The curve should ideally be centered around zero.
Sigma limits
Bell-shaped curve
(Normal distribution)
Specification limits
(Nominal value)
Numbers measuring points
(here in 6µm steps)
Mean value
(Mean)
ASM AVS - USER MANUAL
PAGE 100 OF 182
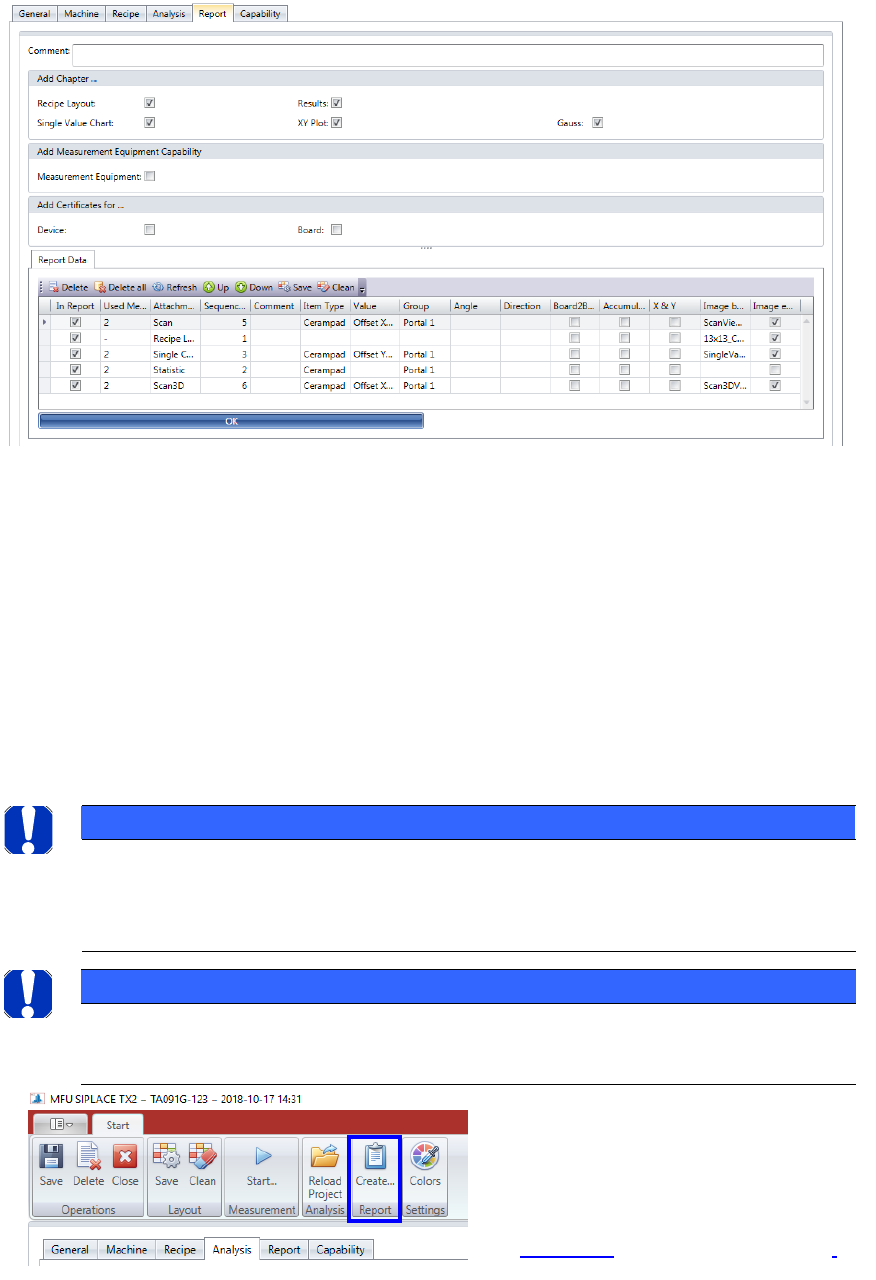
5.2.24.1.6 Project - Report
All the views collected with the “Add to Report” button, are listed in the “Report” tab.
• The different chapters of the report can be selected and deselected.
• An explanatory text for the certification of the measuring tools can also be added to the
report. This text is prepared per default in the tab “Capability”. The text is editable.
• The “Report Data” are listed in the table. Each line stands for one view which was collect-
ed by the “Add to Report” function. Each part can be deselected with the checkbox in the
first column. You can delete either single lines of the table (like selected with the Check-
box), or all entries at once.
You can change the Sequence of the single entries in the report, by using the “Up” and
“Down” button!
NOTICE
Reihefolge der Einträge
Die Anteile am Report können frei sortiert werden. Jedoch gibt es eine Einschränkung, dass Als Eintrag 1
stets das Recipe Layout stehen muss und an Stelle 2 eine Statistic. Er Rest ist frei.
NOTICE
Always remember to click on the “OK” button after the change on a filter tab.
Otherwise the changes will not be saved.
Press the „Create…“ button in the menu
bar to create a *.pdf file as report.
The file will going to be saved under the
name of the project folder (date time).
See 5.2.24.2.3 Mark a project as closed.