JANETS_INM.pdf - 第706页
JaNets In structio n Manual 19 T ra ceMonitor 19 -7 19 -3-4 “Error rankings” screen When you se lect t he “Error rankings” pa nel wit h the cor respond ing pane l switch , this screen appear s. Figure 19 -3- 12 Pane l sw…
JaNets Instruction Manual 19 TraceMonitor
19-6
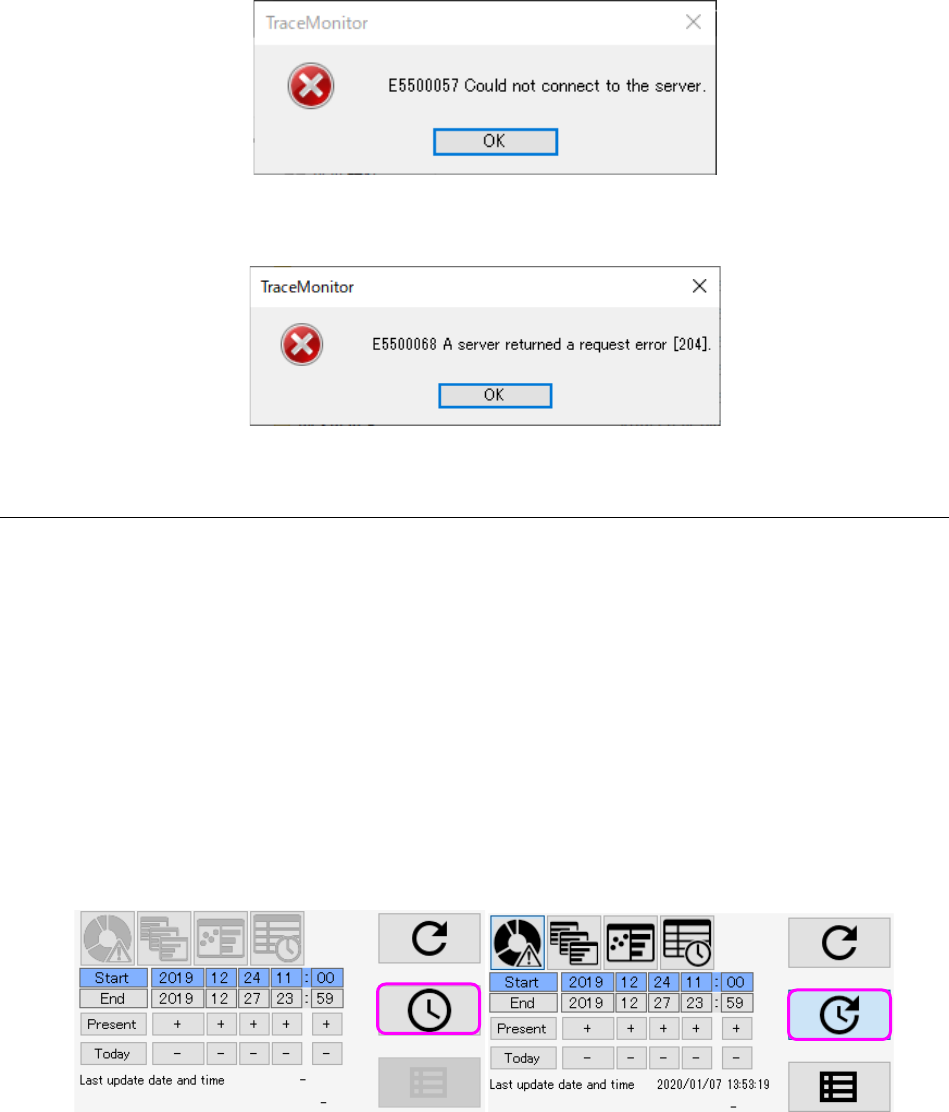
If the system cannot connect to the server, the following message appears on the screen.
Figure 19-3-9 Server connection error message
If any error occurs on the server, the following message appears on the screen.
Figure 19-3-10 Server request error message
19-3-3-2 Automatic update
Automatic update is a function that performs search of information repeatedly under the conditions
set for the menu item “Search period at start-up” at the desired intervals. When you press the
<Alarm update> button when the Automatic update function is set to ON or when you set the
Automatic update function to ON after pressing the <Alarm update> button, TraceMonitor starts
automatic update operation (note that TraceMonitor does not start updating if you change the
Automatic update function setting to ON although you have never searing any information).
After update starts, the columns for entering the date for searching data displayed on the upper left
corner are updated automatically also. If a condition for searching data by a production program
name is set, TraceMonitor updates data under this condition also.
If TraceMonitor cannot connect to the server or any error occurs at the server when data is updated,
TraceMonitor does not update the data automatically. In this case, when you set the Automatic
update function to ON again, TraceMonitor restarts automatic update operation. When a user
presses the <Alarm update> button, automatic update operation is canceled too.
Figure 19-3-11 Automatic update button (ON/OFF)
JaNets Instruction Manual 19 TraceMonitor
19-7
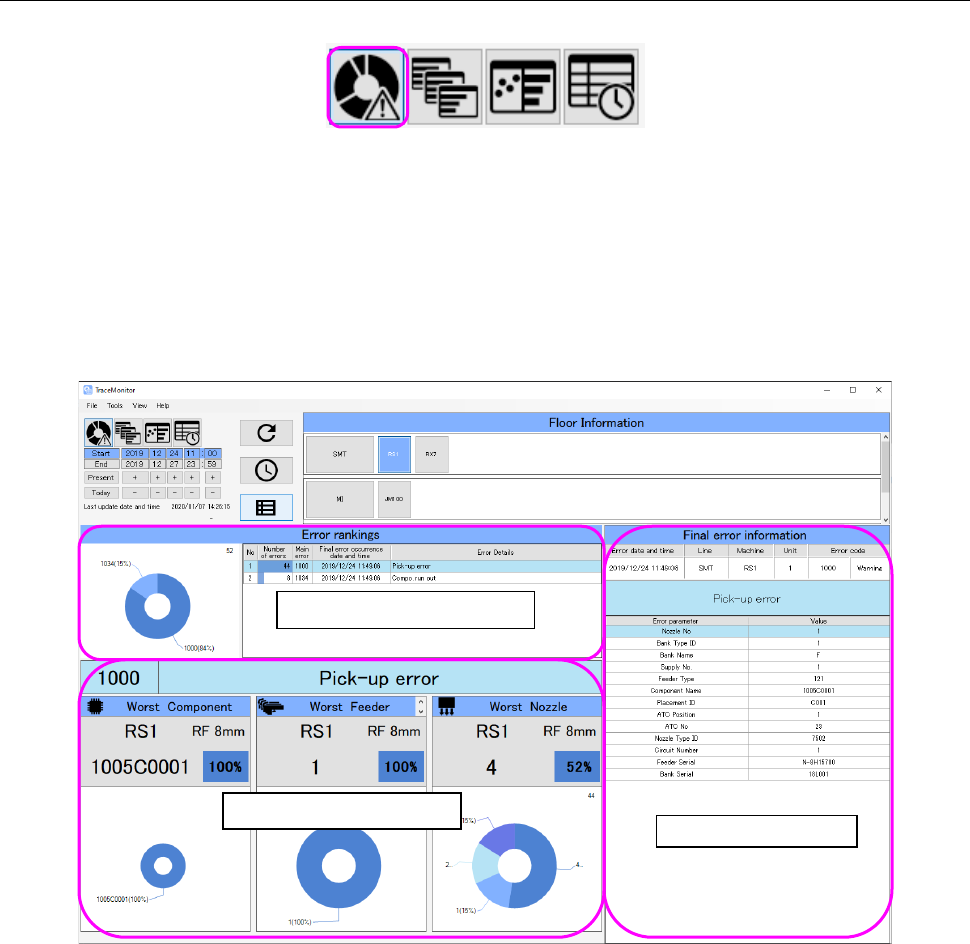
19-3-4 “Error rankings” screen
When you select the “Error rankings” panel with the corresponding panel switch, this screen appears.
Figure 19-3-12 Panel switches
The “Error rankings” screen shows three types of information: ranking information, worst ranking
information and Final error information all of which are on a production line or machine selected on
the “Floor Information” screen.
It shows the worst ranking information and final error information for an error selected from the Error
rankings.
Figure 19-3-13 “Error rankings” screen
Error ranking information
Worst ranking information
Final error information
JaNets Instruction Manual 19 TraceMonitor
19-8
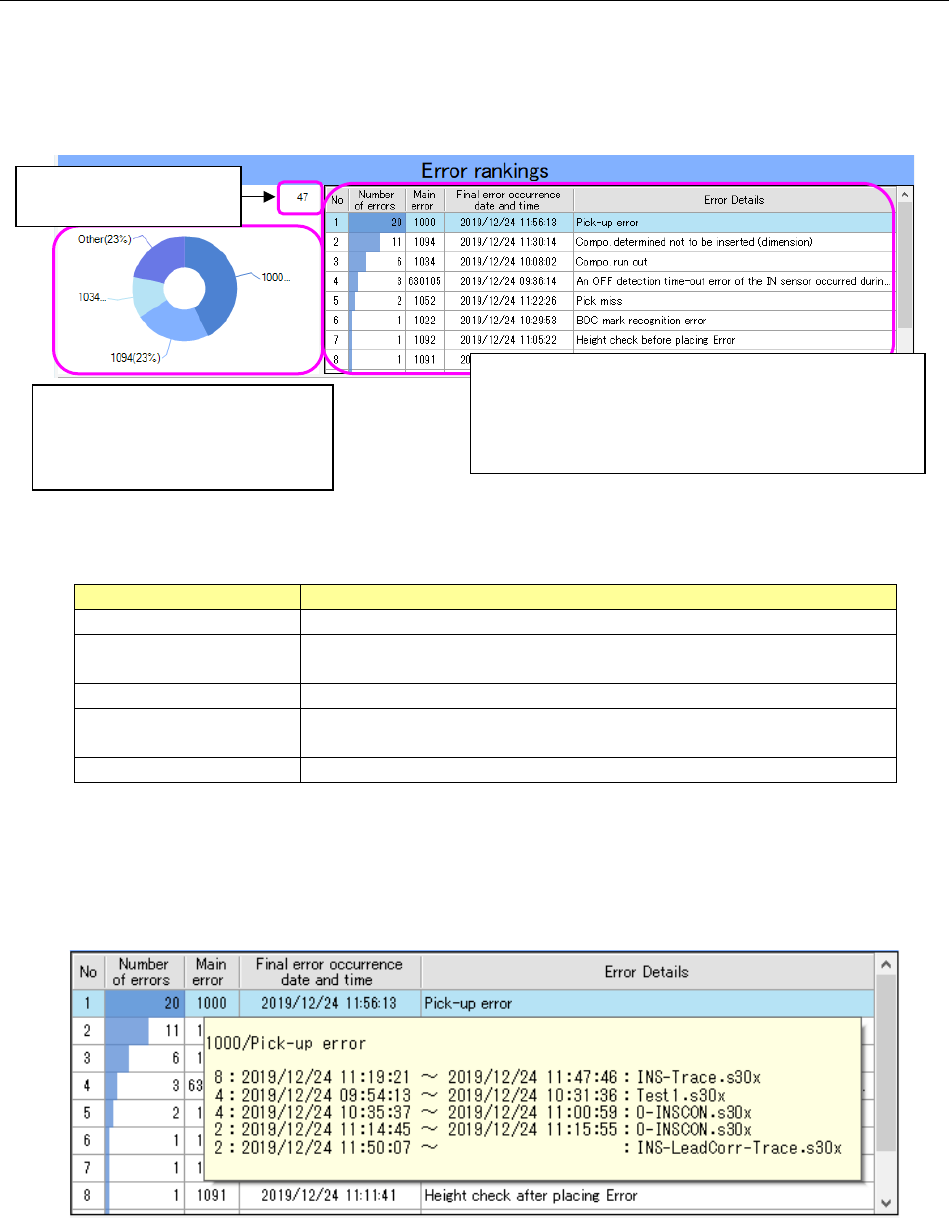
19-3-4-1 Error rankings information
TraceMonitor collects error information, and then shows errors that occurred most frequently and
caused the productivity of the system to decrease in a ranking format and in a circle graph.
Generated errors are categorized by main errors, and displayed in descending order from the most
frequently generated error.
Figure 19-3-14 “Error rankings” information
Table 19-3-2 Items of the “Error rankings” list
Item
Description
No
Displays a serial number of data.
Number of errors
Displays the number of errors counted and categorized
according to the main errors.
Main error
Displays an error code of an error that occurred.
Final error occurrence
date and time
Displays the date and time when an error of the same category
occurred the last time.
Error details
Displays the description of the main error.
When you check off the “Add production program information to the error ranking” check box on the
“Set Environments” screen, descriptions of errors and production information on the first five places
of errors are displayed in the tool tip format when you align the cursor with data shown on the “Error
rankings” screen.
Figure 19-3-15 Production information shown from the “Error rankings” information
The first three places are displayed
individually at most, and the fourth
error and errors after it are
displayed collectively as “Other.”
The number of data
records is displayed here.
The selected error is displayed in yellow.
The number of errors is shown in a bar graph by
comparing to the number of the most frequently
generated errors in the “Number of errors” column.