JANETS_INM.pdf - 第707页
JaNets In structio n Manual 19 T ra ceMonitor 19 -8 19 -3-4-1 Error r ankings information T raceMonitor collects er ror inform ation, and then shows er rors t hat occ urred m ost freq uent ly and caused the pr oductiv it…
JaNets Instruction Manual 19 TraceMonitor
19-7
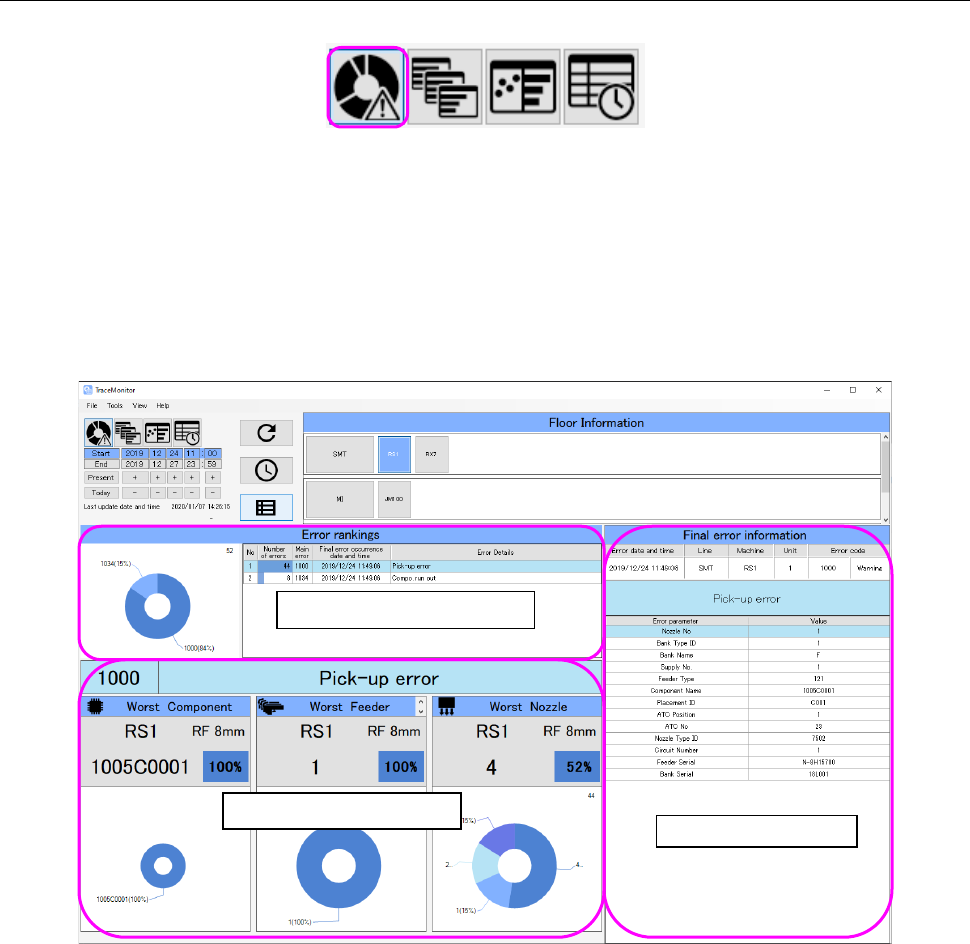
19-3-4 “Error rankings” screen
When you select the “Error rankings” panel with the corresponding panel switch, this screen appears.
Figure 19-3-12 Panel switches
The “Error rankings” screen shows three types of information: ranking information, worst ranking
information and Final error information all of which are on a production line or machine selected on
the “Floor Information” screen.
It shows the worst ranking information and final error information for an error selected from the Error
rankings.
Figure 19-3-13 “Error rankings” screen
Error ranking information
Worst ranking information
Final error information
JaNets Instruction Manual 19 TraceMonitor
19-8
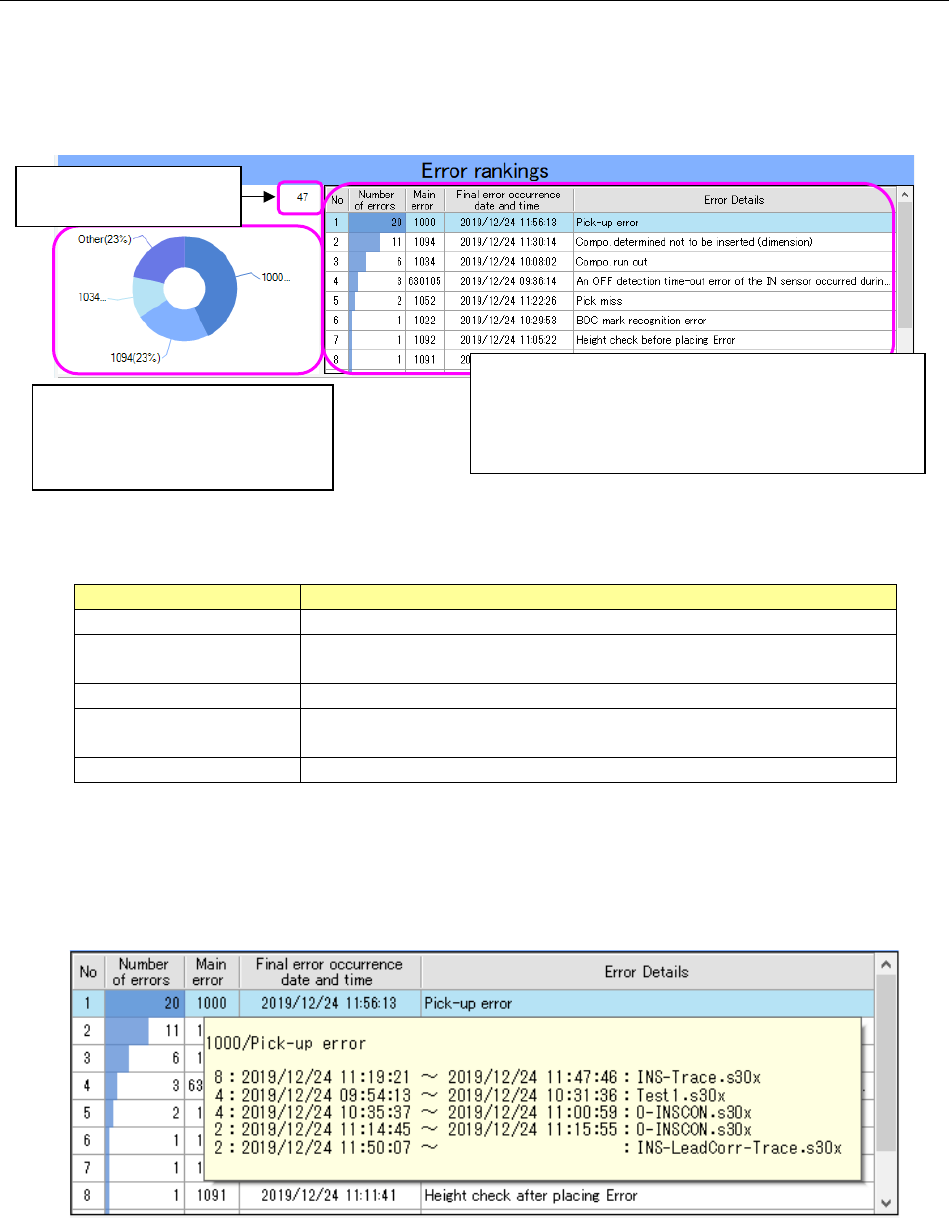
19-3-4-1 Error rankings information
TraceMonitor collects error information, and then shows errors that occurred most frequently and
caused the productivity of the system to decrease in a ranking format and in a circle graph.
Generated errors are categorized by main errors, and displayed in descending order from the most
frequently generated error.
Figure 19-3-14 “Error rankings” information
Table 19-3-2 Items of the “Error rankings” list
Item
Description
No
Displays a serial number of data.
Number of errors
Displays the number of errors counted and categorized
according to the main errors.
Main error
Displays an error code of an error that occurred.
Final error occurrence
date and time
Displays the date and time when an error of the same category
occurred the last time.
Error details
Displays the description of the main error.
When you check off the “Add production program information to the error ranking” check box on the
“Set Environments” screen, descriptions of errors and production information on the first five places
of errors are displayed in the tool tip format when you align the cursor with data shown on the “Error
rankings” screen.
Figure 19-3-15 Production information shown from the “Error rankings” information
The first three places are displayed
individually at most, and the fourth
error and errors after it are
displayed collectively as “Other.”
The number of data
records is displayed here.
The selected error is displayed in yellow.
The number of errors is shown in a bar graph by
comparing to the number of the most frequently
generated errors in the “Number of errors” column.
JaNets Instruction Manual 19 TraceMonitor
19-9
19-3-4-2 Worst ranking information
The Worst ranking information shows the result obtained by summarizing data on errors that
occurred frequently at each unit located inside the machine as for an error selected in the “Error
rankings” list.
The result is summarized with the following three categories: Worst Component, Worst Feeder and
Worst Nozzle.
Figure 19-3-16 Worst ranking information
When you click the cursor, the displayed data on the worst feeder is changed to data on the worst
serial number.
Figure 19-3-17 Worst serial number
The main error code selected in the “Error
rankings” information list is displayed here.
Description of an error of the main
error code is displayed here.
The name of the worst
machine is displayed here.
The name of the worst
component is displayed here.
* When the name is long, the
smaller fonts are used, and
the name wraps around.
The first five places are displayed,
and the sixth feeder and feeders
(components or nozzles) after it
are displayed collectively as
“Other.”
The feeder type of a machine
at which an error occurred is
displayed here.
The number of the worst
nozzle head is displayed here.
The position of the worst
feeder is displayed here.
Switching the data to be
displayed on the screen
The serial number of the worst
feeder is displayed here.
The ratio of the worst nozzle
(component or feeder) to the
total is displayed here.