JANETS_INM.pdf - 第717页
JaNets In structio n Manual 19 T ra ceMonitor 19 - 18 19 -3-6 Timeline scr een The timeline s creen a ppears wh en you select the ti meline pane l of the pan el switches. Figure 19 -3- 29 Pane l switches The timeline scr…
JaNets Instruction Manual 19 TraceMonitor
19-17
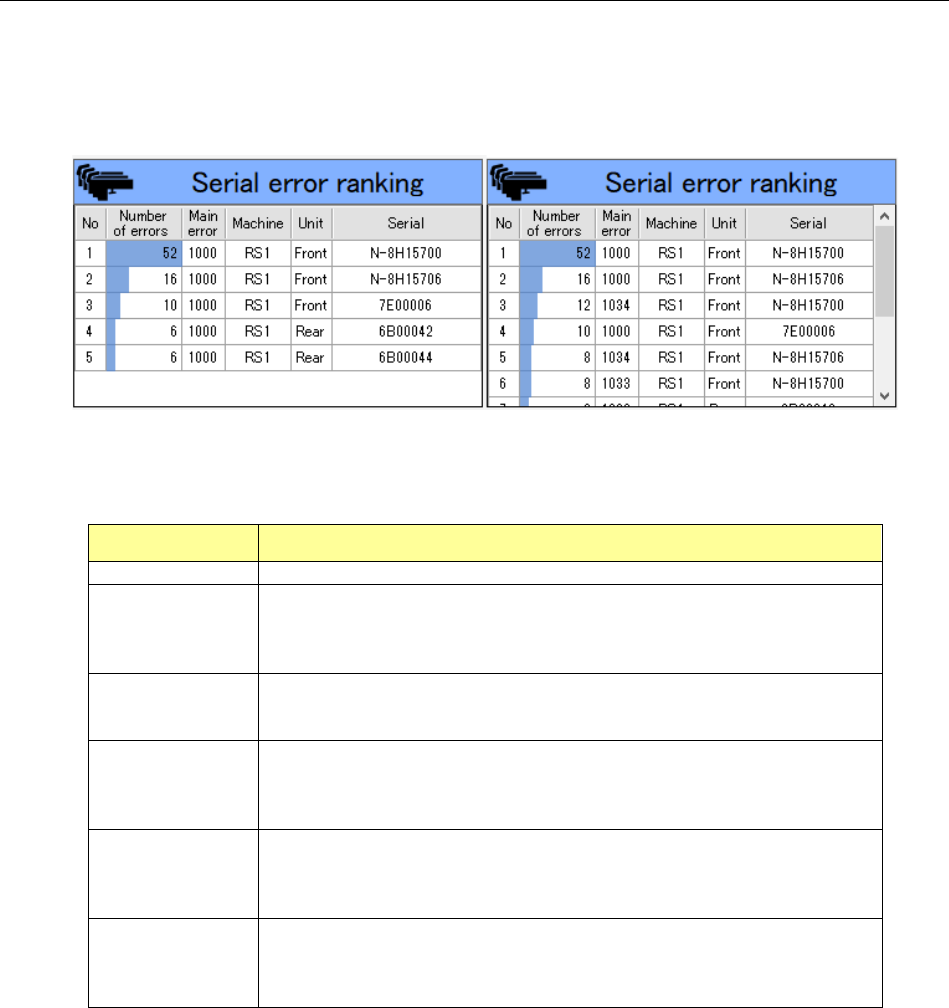
19-3-5-8 Serial error ranking information
The “Serial error ranking” information shows the ranking of each feeder serial number according to
the error code selected in the “Error rankings” information list.
When any error code is not selected in the “Error rankings” information list, this screen shows the
feeder serial error ranking for all error codes.
Figure 19-3-28 “Feeder serial error ranking” information
(Left: when an error code is selected/Right: when any error code is not selected)
Table 19-3-9 Items of the “Serial error ranking” information
Item Description
No
Displays a serial number
Number of errors
Displays the number of errors counted for each feeder serial number as for
the selected error code.
When any error code is not selected, this column shows the number of
errors counted for each feeder serial number as for all error codes.
Main error
Displays the main error for the selected error code.
When any error code is not selected, this column shows the main errors for
all error codes.
Machine
Displays the name of a machine at which an error occurred as for the
selected error code.
When any error code is not selected, this column shows the name of each
machine at which an error occurred as for all error codes.
Unit
Displays a unit of a machine at which an error occurred as for the selected
error code.
When any error code is not selected, this column shows a unit of each
machine at which an error occurred as for all error codes.
Serial
Displays the serial number of a feeder at which an error occurred as for the
selected error code.
When any error code is not selected, this column shows the serial number
of each feeder at which an error occurred as for all error codes.
JaNets Instruction Manual 19 TraceMonitor
19-18
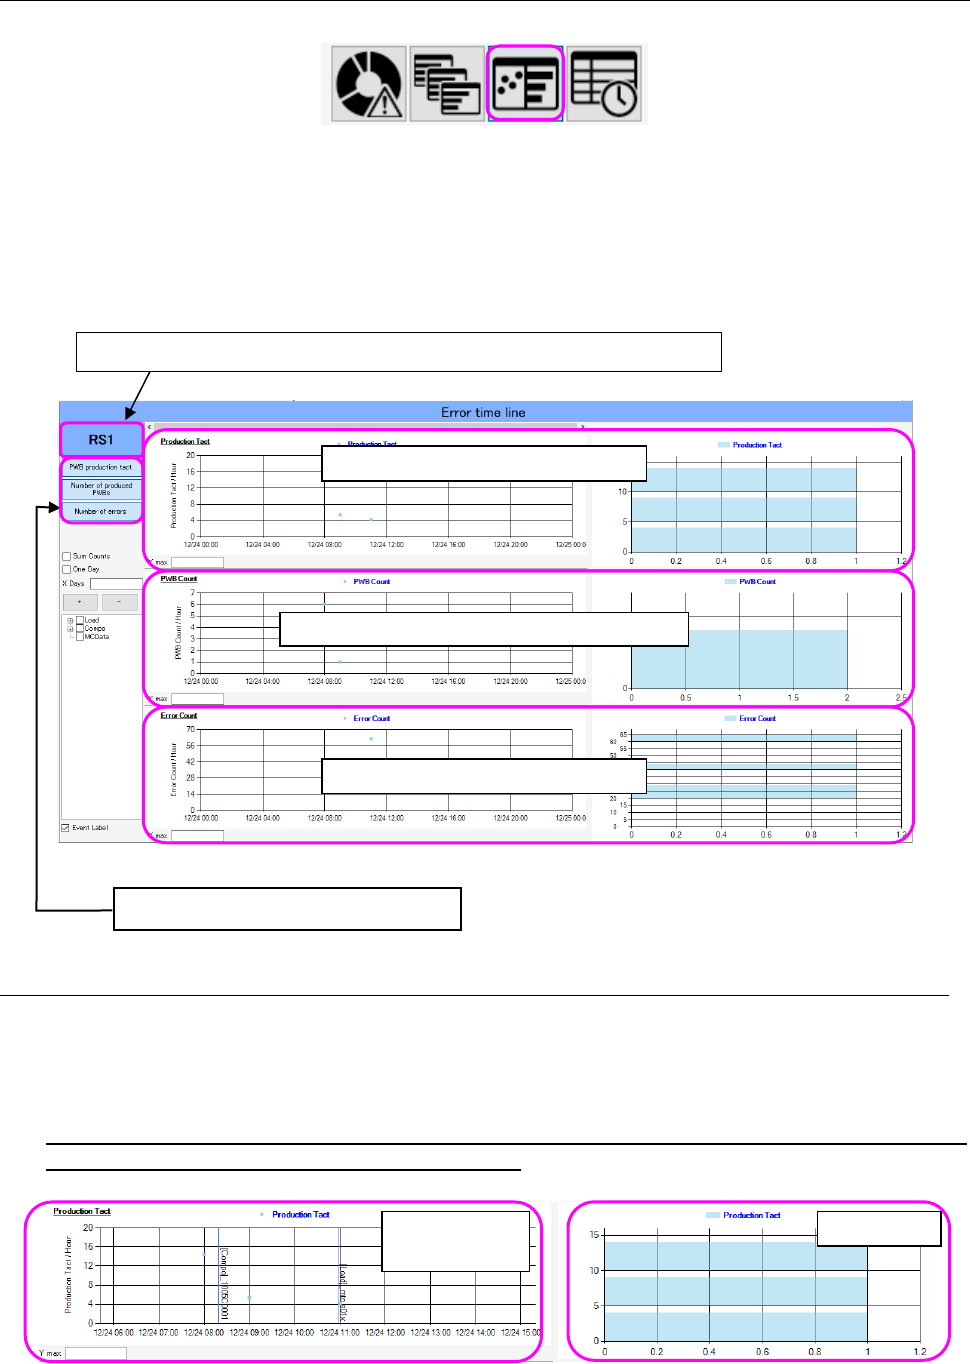
19-3-6 Timeline screen
The timeline screen appears when you select the timeline panel of the panel switches.
Figure 19-3-29 Panel switches
The timeline screen shows the PWB production tact, number of produced PWBs and the number of
errors of a machine or production line selected with the Floor information function in a graph and by
the histogram.
As for an event, the description of an event is indicated by drawn vertical lines and displayed at the
occurrence date and time on the graph.
Figure 19-3-30 Timeline screen
19-3-6-1 PWB production tact information
As for the PWB production tact, an average value of the production tact of each machine for one
hour is shown on the graph.
Data expressed by the histogram within the display range of the graph is displayed on the right side
of the graph.
When a production line is selected on the
“Floor Information” screen, any value is not
displayed on the “PWB Production Tact” graph.
Figure 19-3-31 PWB production tact information
The name of a production line or a machine being selected is displayed here.
Each graph can be displayed or hidden.
PWB production tact information
Information on the number of produced PWBs
Information on the number of errors
PWB production
tact graph
Histogram
JaNets Instruction Manual 19 TraceMonitor
19-19
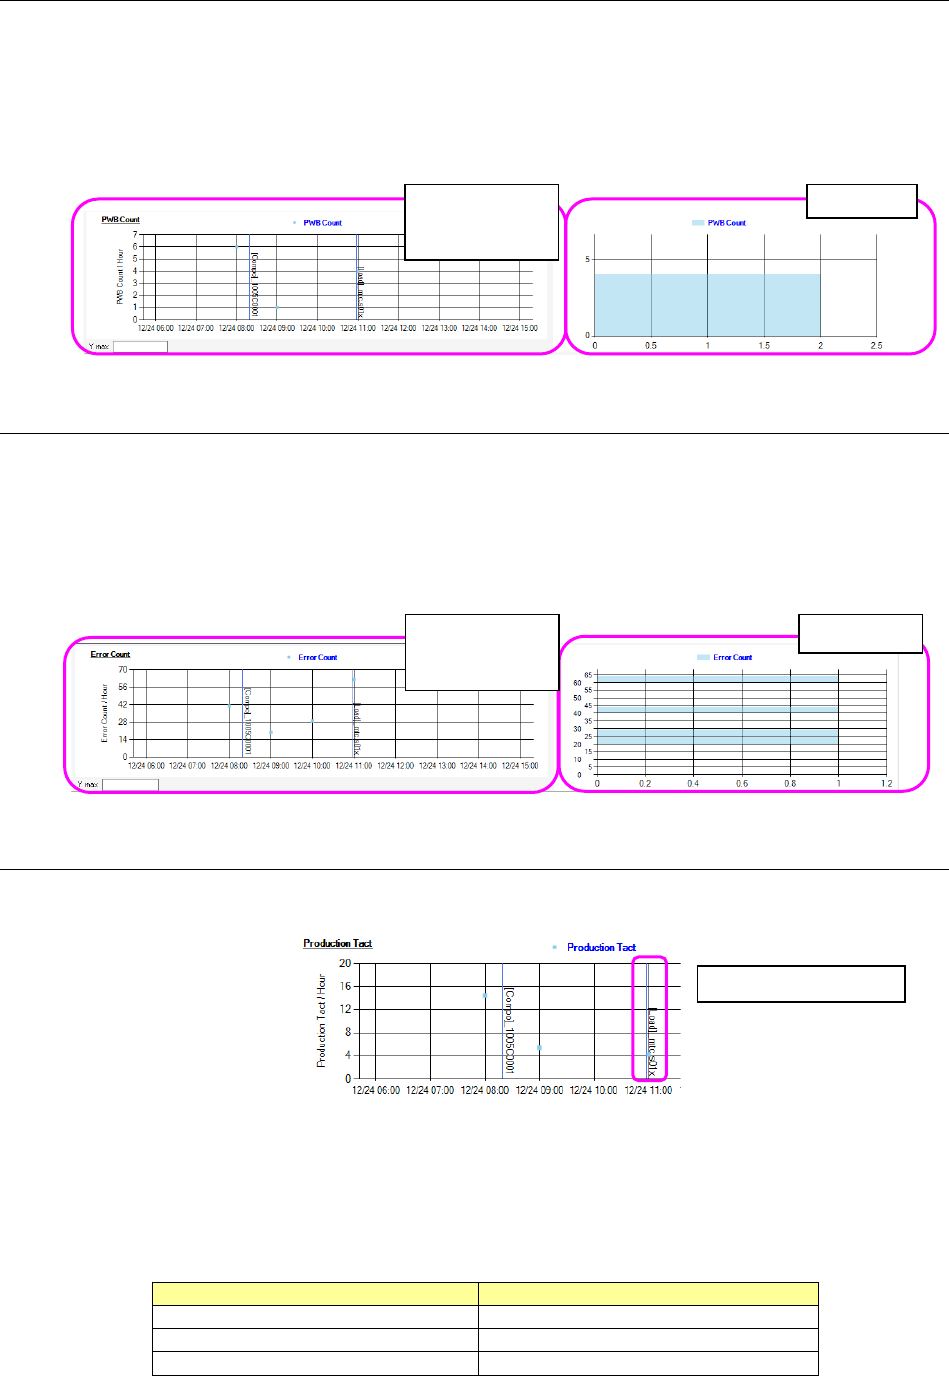
19-3-6-2 Information on the number of produced PWBs (PWB Count)
The “PWB Count” screen shows the total of the number of PWBs produced with each machine per
hour on a graph.
Data obtained within the display period is expressed in a form of histogram on the right side of the
graph.
When a production line is selected, a total value of PWBs produced with a machine assigned to the
end of the production line is displayed on the graph.
Figure 19-3-32 Information on the number of produced PWBs
19-3-6-3 Information on the number of errors (Error Count)
The “Error Count” screen shows the number of errors that occurred at the machine and was counted
per hour on a graph.
Data obtained within the display period is expressed in a form of histogram on the right side of the
graph.
When a production line is selected, the total of errors that occurred at each machine and was counted
per hour is displayed also.
Figure 19-3-33 Information on the number of errors
19-3-6-4 Event display
The event display shows description of an event at the occurrence date and time on the graph by
drawing blue vertical lines.
Figure 19-3-34 Event display
The following three types of events are displayed: change of a production program, teaching or
editing of a component and editing of machine data.
Each event is displayed as shown in the table below.
Table 19-3-10 Generated events
Event
Display
Change of a production program
[Load]_production program name
Teaching or editing of a component
[Compo]_component name
Editing of machine data
[MCData]
Histogram
Graph indicating
the number of
errors
Histogram
Graph indicating
the number of
produced PWBs
Displays a Load event