JANETS_INM.pdf - 第718页
JaNets In structio n Manual 19 T ra ceMonitor 19 - 19 19 -3-6-2 Informati on on the number of produced PWBs (PWB Count) The “PWB Count ” scre en shows the t otal of the number of PWBs pr oduced with each mac hine per hou…
JaNets Instruction Manual 19 TraceMonitor
19-18
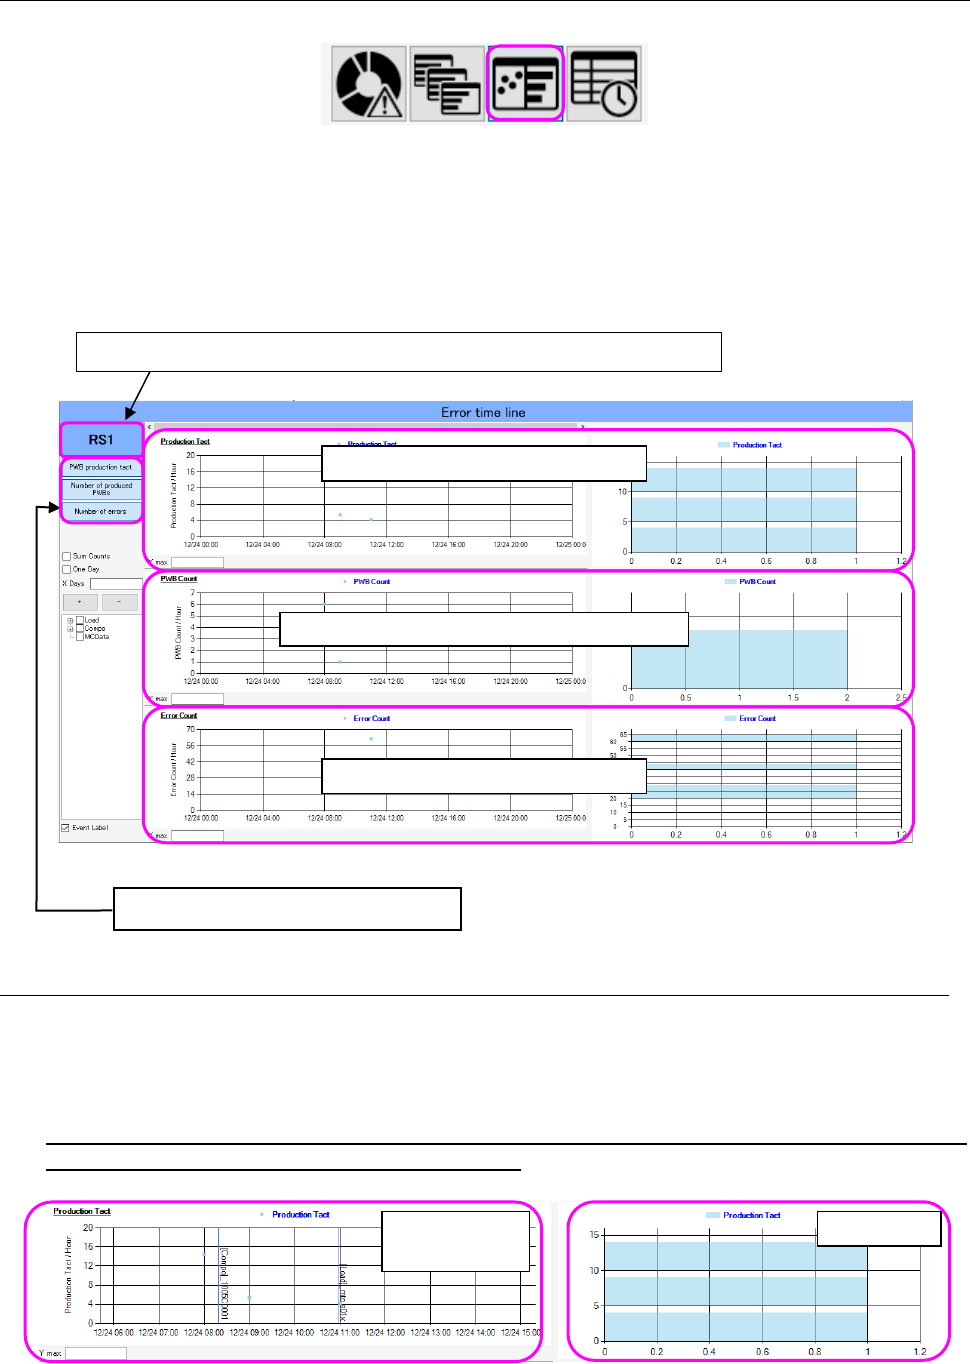
19-3-6 Timeline screen
The timeline screen appears when you select the timeline panel of the panel switches.
Figure 19-3-29 Panel switches
The timeline screen shows the PWB production tact, number of produced PWBs and the number of
errors of a machine or production line selected with the Floor information function in a graph and by
the histogram.
As for an event, the description of an event is indicated by drawn vertical lines and displayed at the
occurrence date and time on the graph.
Figure 19-3-30 Timeline screen
19-3-6-1 PWB production tact information
As for the PWB production tact, an average value of the production tact of each machine for one
hour is shown on the graph.
Data expressed by the histogram within the display range of the graph is displayed on the right side
of the graph.
When a production line is selected on the
“Floor Information” screen, any value is not
displayed on the “PWB Production Tact” graph.
Figure 19-3-31 PWB production tact information
The name of a production line or a machine being selected is displayed here.
Each graph can be displayed or hidden.
PWB production tact information
Information on the number of produced PWBs
Information on the number of errors
PWB production
tact graph
Histogram
JaNets Instruction Manual 19 TraceMonitor
19-19
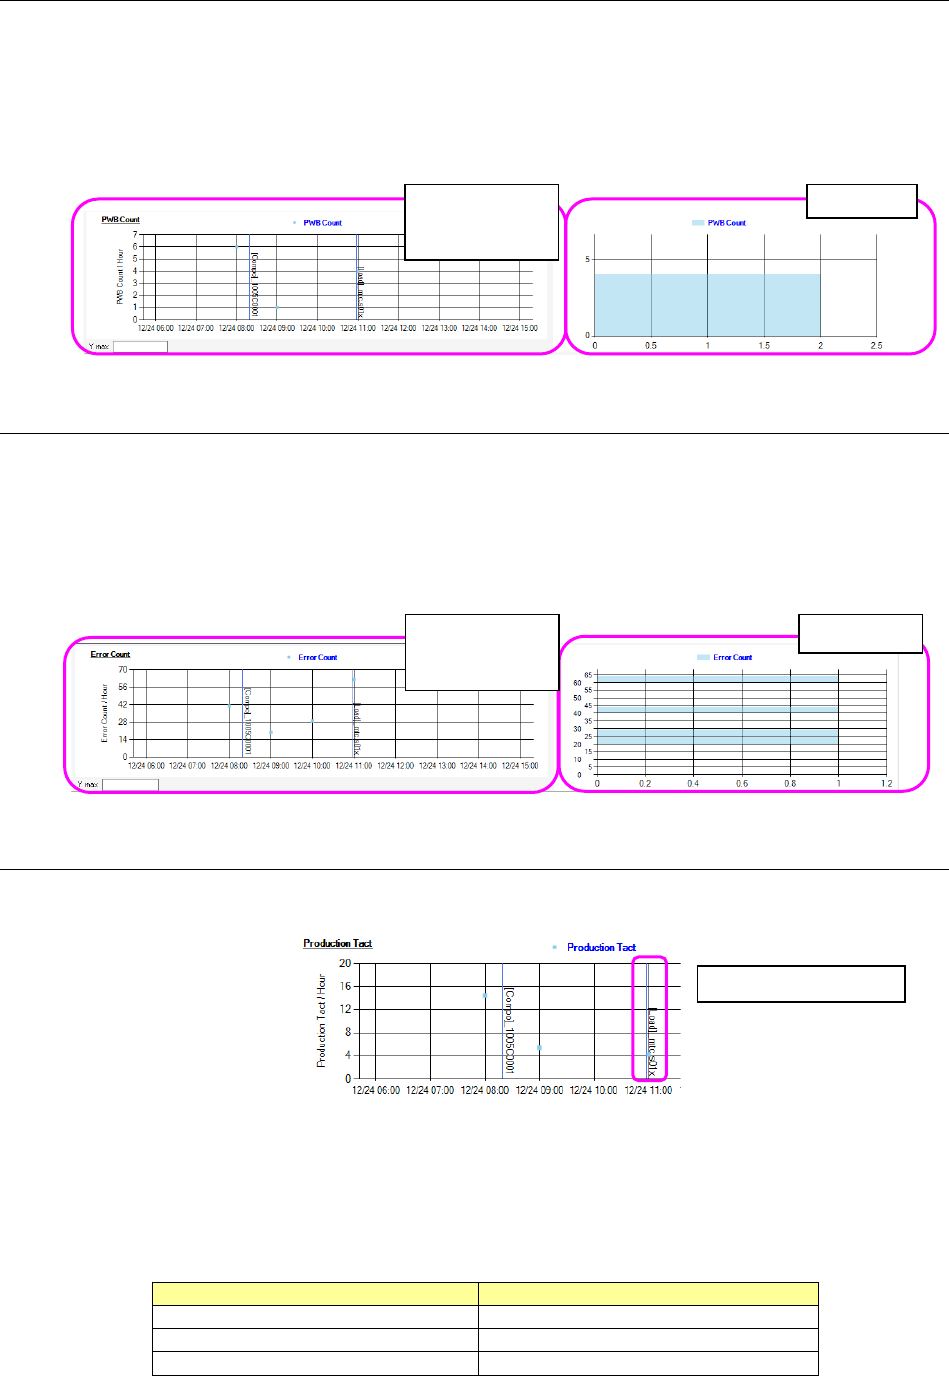
19-3-6-2 Information on the number of produced PWBs (PWB Count)
The “PWB Count” screen shows the total of the number of PWBs produced with each machine per
hour on a graph.
Data obtained within the display period is expressed in a form of histogram on the right side of the
graph.
When a production line is selected, a total value of PWBs produced with a machine assigned to the
end of the production line is displayed on the graph.
Figure 19-3-32 Information on the number of produced PWBs
19-3-6-3 Information on the number of errors (Error Count)
The “Error Count” screen shows the number of errors that occurred at the machine and was counted
per hour on a graph.
Data obtained within the display period is expressed in a form of histogram on the right side of the
graph.
When a production line is selected, the total of errors that occurred at each machine and was counted
per hour is displayed also.
Figure 19-3-33 Information on the number of errors
19-3-6-4 Event display
The event display shows description of an event at the occurrence date and time on the graph by
drawing blue vertical lines.
Figure 19-3-34 Event display
The following three types of events are displayed: change of a production program, teaching or
editing of a component and editing of machine data.
Each event is displayed as shown in the table below.
Table 19-3-10 Generated events
Event
Display
Change of a production program
[Load]_production program name
Teaching or editing of a component
[Compo]_component name
Editing of machine data
[MCData]
Histogram
Graph indicating
the number of
errors
Histogram
Graph indicating
the number of
produced PWBs
Displays a Load event
JaNets Instruction Manual 19 TraceMonitor
19-20
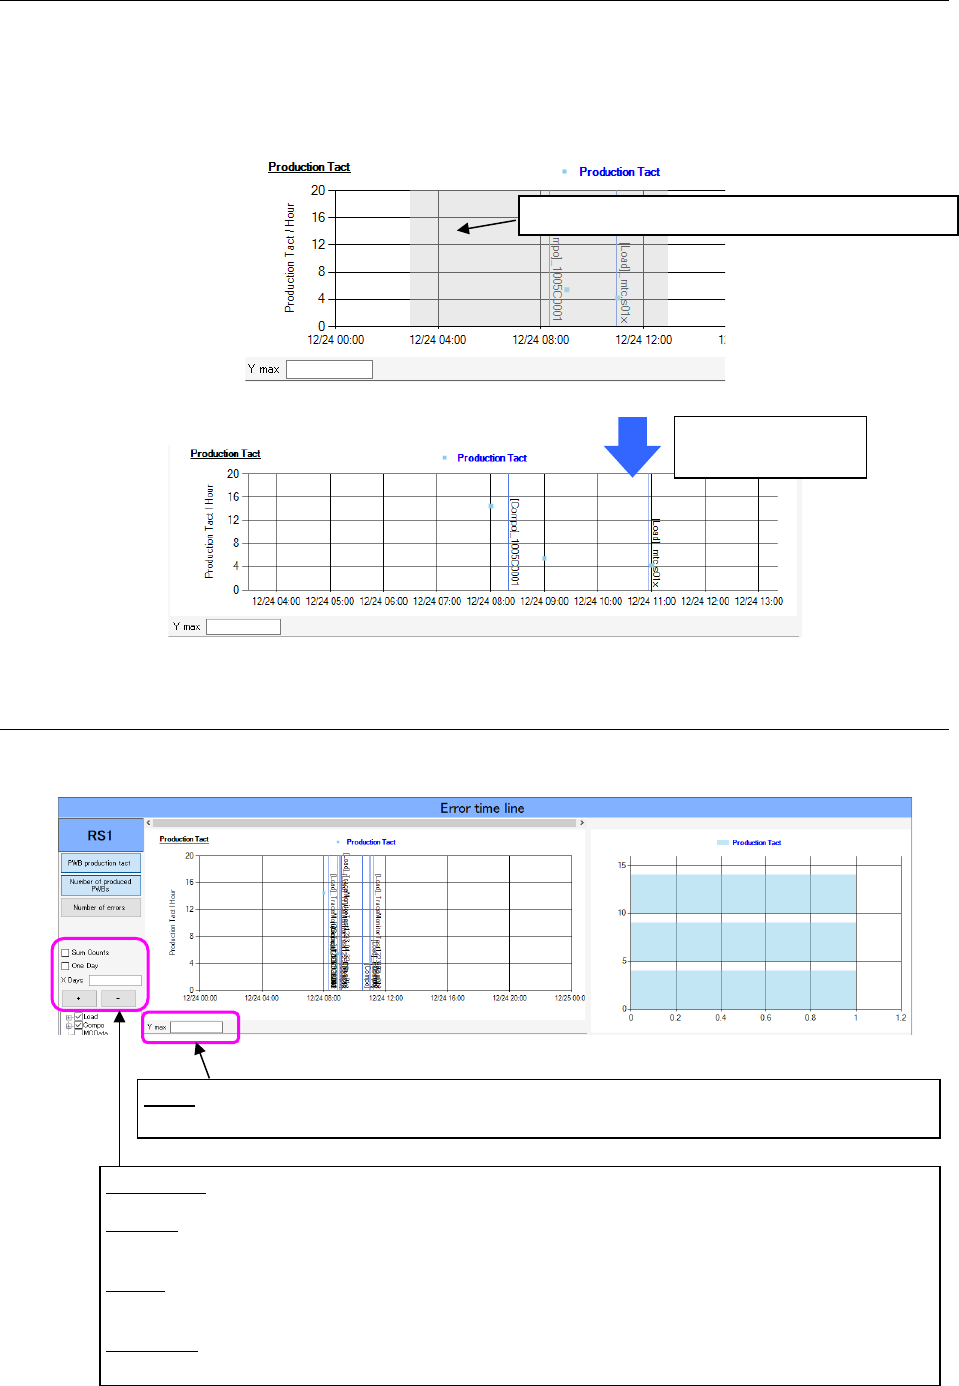
19-3-6-5 Selecting the range of the display period
You can select the range of the display period with dragging the desired position of the graph with
the mouse left button.
The shortest display range you can select is one hour.
Only if you do not check off the “One Day” check box, you can return the display range to the initial
range by pressing the mouse right button on the graph.
Figure 19-3-35 The range for the display period is being selected.
Figure 19-3-36 After the range for the display period is selected
19-3-6-6 Display option
You can change the displayed graph with the items on the left side of the screen: Sum Counts, One
Day and X Days and the setting of the item “Y max” displayed under each graph.
Figure 19-3-37 Display options of the timeline data
The range being selected is displayed in light gray.
Selection of the range
for the display period
Y max: Sets the maximum displayed value of the Y-axis of the graph and that of the histogram.
You can set this value for each graph.
Sum Counts: Changes the values of the graph to the integrated values.
One Day: Sets the display period in units of days. When you check off this check box, the
following items are disabled: “X Days” and +/- button operations.
X Days: Sets the display period in units of the entered number of days. The shortest display
period is 0.042 (one hour).
+/- buttons: Time-axis enlargement/reduction buttons. The + button enlarges the display period,
while the – button reduces the display period.