JANETS_INM.pdf - 第723页
JaNets In structio n Manual 19 T ra ceMonitor 19 - 24 19 -3-8 Corrective actio n When you s elect t he men u comma nds: [V ie w (V)] a nd [Corre ctive Ac tion (A)] in this or der while the error rankin g informat ion is …
JaNets Instruction Manual 19 TraceMonitor
19-23
19-3-7 Error history screen
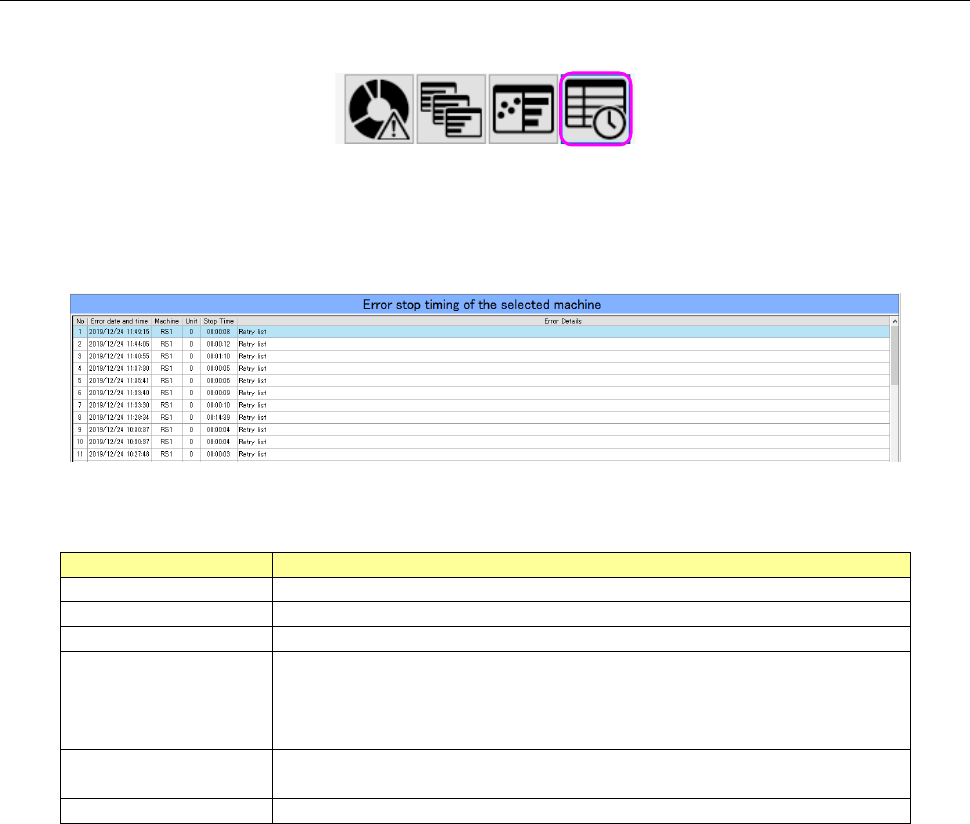
When you select the “Error history” panel with the corresponding panel switch, this screen appears.
Figure 19-3-43 Panel switches
The Error history screen chronemically shows stop of a machine caused by an error that occurred
on a machine or a device of a production line selected with the Floor Information function.
Figure 19-3-44 Error history screen
Table 19-3-11 Items of the Error history screen
Item
Description
No
Displays a serial number of data.
Error date and time
Displays the date and time when the system stopped due to an error.
Machine
Displays the name of a machine at which an error stop occurred.
Unit
Displays the name of a unit of a machine at which an error stop
occurred.
RX-7 0: Entire machine 1: Right side only 2: Left side only *1
Others 0: Entire machine
Stop Time
Displays the time period while the system was stopping due to an
error.
Error Details
Displays the description of the main error.
*1 If the entire machine stops after an error stop occurred on a single side, this error is displayed
as entire machine.
JaNets Instruction Manual 19 TraceMonitor
19-24
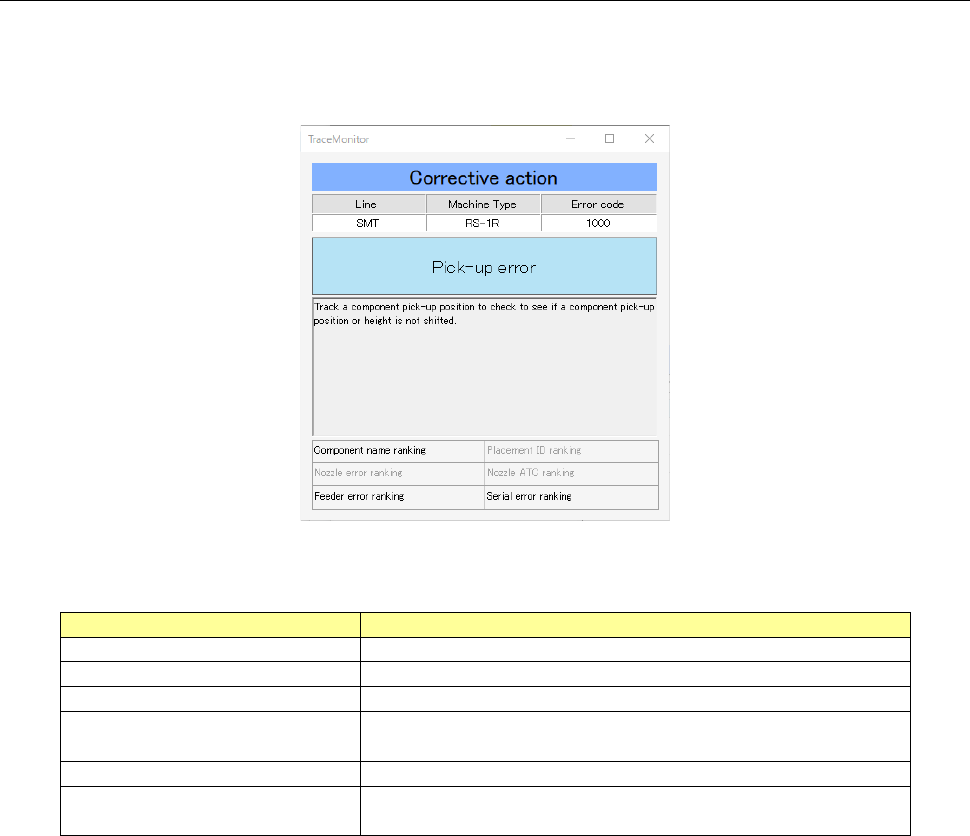
19-3-8 Corrective action
When you select the menu commands: [View (V)] and [Corrective Action (A)] in this order while the
error ranking information is being selected on the Error rankings panel or the Individual ranking panel,
the corrective action corresponding to an error is displayed on the screen.
Figure 19-3-45 “Corrective Action” dialog box
Table 19-3-12 Description of the “Corrective Action” dialog box
Item
Description
Line
Displays the name of a production line.
Machine Type
Displays the name of a machine at which an error occurred.
Error code
Displays the error code of an error that occurred.
Error description
Displays the description of an error corresponding to the
error code.
Corrective action
Displays the corrective action corresponding to an error.
Individual error ranking name
Displays the individual rankings you should notice when
you handle an error that occurred.
JaNets Instruction Manual 19 TraceMonitor
19-25
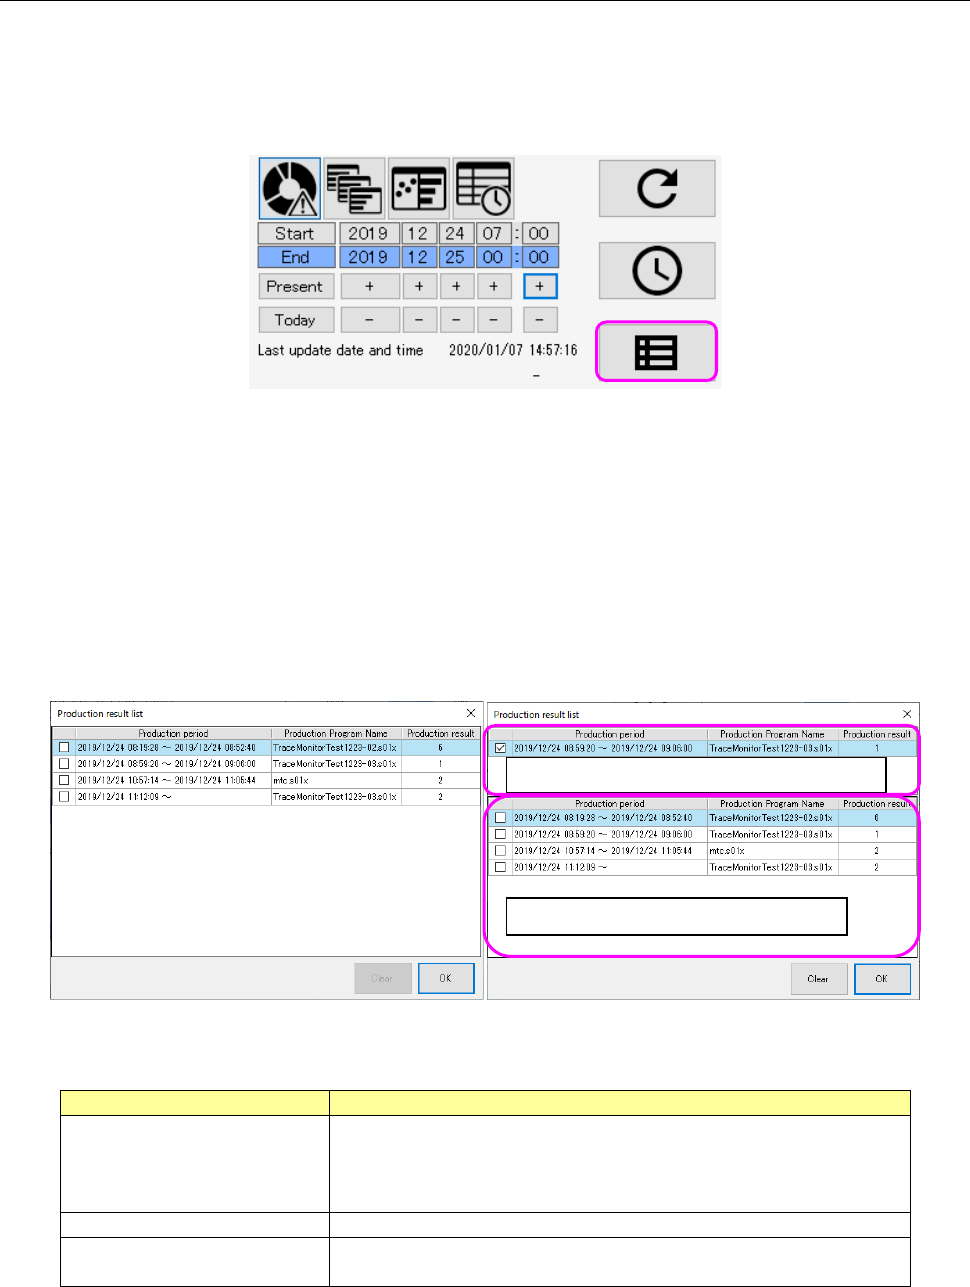
19-3-9 Selecting a production program
The time period in which each production program is to be searched from alarm data satisfying the
search condition is displayed.
When you select a production program, you can search for each type of errors within the production
period.
Figure 19-3-46 Production program selecting button
When you press the production program selecting button, the “Production result list” is displayed in
the ascending order of start time. When you select one desired production period and press the
<OK> button, your selection is reflected in the search time.
The “Production result list” can display simultaneously two types of data, the longest period of alarm
data among the updated alarm data and the alarm data searched the last time. When these two
types of data are the same, they are displayed as shown in the left figure below. When they are
different from each other, they are shown in the right figure below.
When you press the <Clear> button, the longest period of production result data is deleted.
Figure 19-3-47 “Production result list” screen
Table 19-3-13 Items of the “Production result list”
Item
Description
Production period
Displays the duration from when production starts until when it
ends in units of seconds.
It is displayed as blank for data being used for production at
the preset or if the production end time cannot be obtained.
Production Program Name
Displays a production program name.
Production result
Displays the number of PWBs produced within the production
period.
Production result data searched the last time
Longest period of production result data