KE2010.Instruction Manual.Ver.2.01,Rev.08.pdf - 第411页
6 − 35 ⑤ MT S W hen you select the [W indow] command from the menu bar , the [Management Inf o.] comm and on the displayed menu, then t he [MTS] command, the screen shown in Figure 6.2.3.1. 5 appears. Figure 6.2. 3.1.5 P…
6 − 34
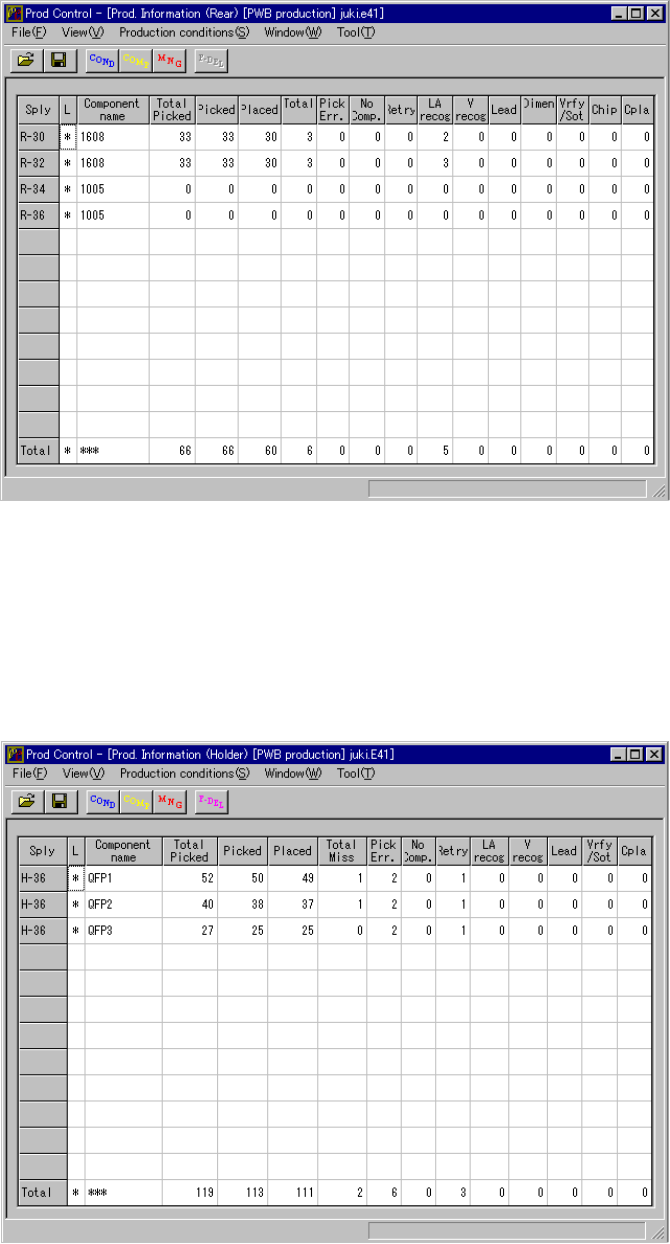
③ Rear
When you select the [Window] command from the menu bar, the [Management
Info.] command on the displayed menu, then the [Rear] command, the screen
shown in Figure 6.2.3.1.3 appears.
Figure 6.2.3.1.3 Prod. Information (Rear)
④ Holder
When you select the [Window] command from the menu bar, the [Management
Info.] command on the displayed menu, then the [Holder] command, the screen
shown in Figure 6.2.3.1.4 appears.
Figure 6.2.3.1.4 Prod. Information (Holder)
6 − 35
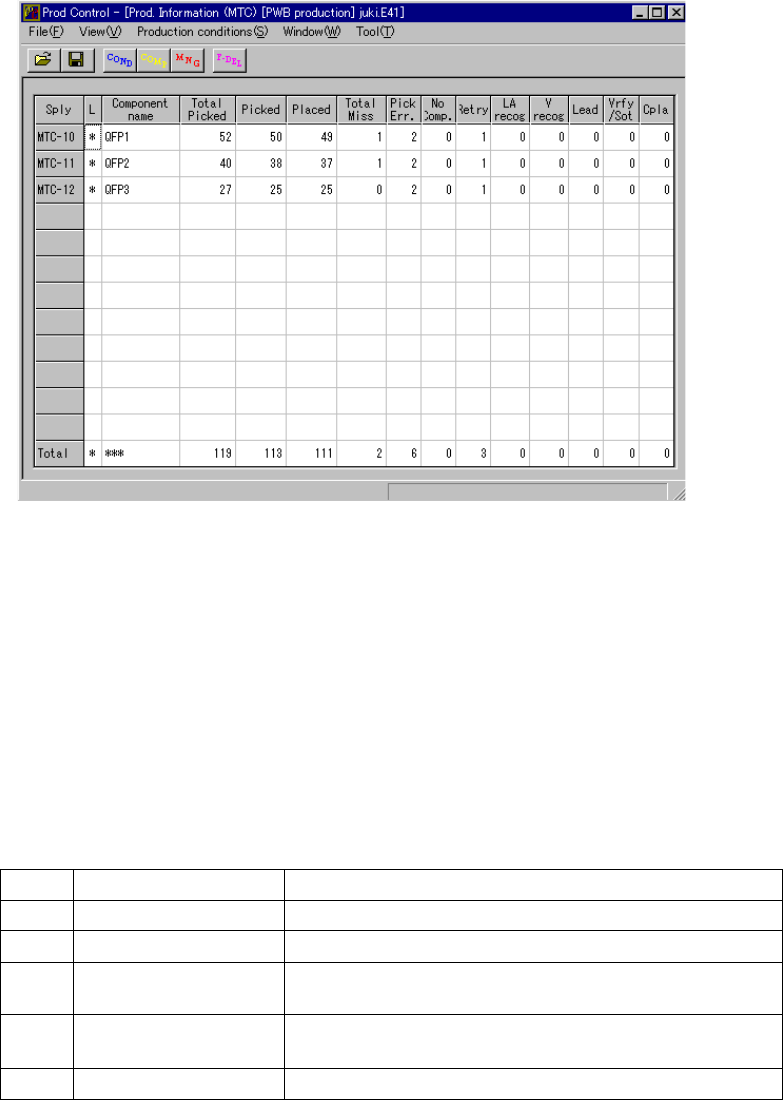
⑤ MTS
When you select the [Window] command from the menu bar, the [Management
Info.] command on the displayed menu, then the [MTS] command, the screen
shown in Figure 6.2.3.1.5 appears.
Figure 6.2.3.1.5 Prod. Information (MTS)
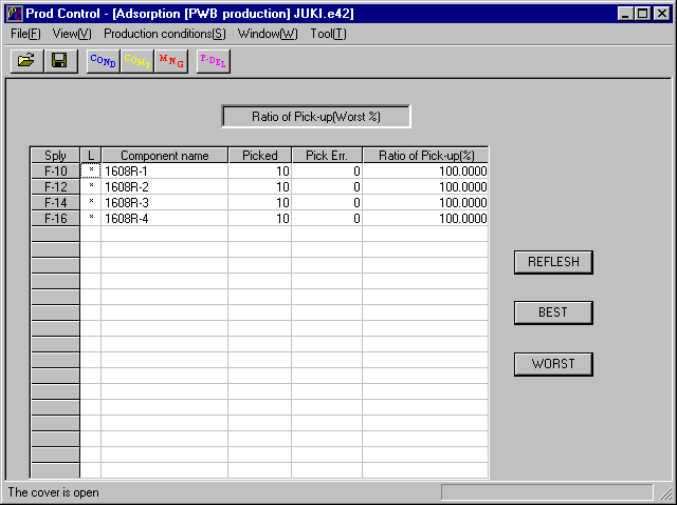
⑥ Ratio of Pick-up
When you select the [Window] command on the menu bar, and then select the
[Management Info.] command and the [Ratio of Pick-up] command on the
displayed menu in this order, the system displays the “component pick-up ratio of
each feeder (Ratio of Pick-up = Picked / (Picked + Pick Err.)).
(1) Menu items
Display of “Ratio of Pick-up”
No. Item Description
1 Sply Position of each feeder
2 Component name Displays the component name.
3 Picked Number of components successfully picked up from the
specified feeder
4 Pick Err. Number of components that failed to be picked up with the
specified feeder
5 Ratio of Pick-up (%) Ratio of Pick-up = Picked / (Picked + Pick Err.)
6 − 36
(2) Displayed screen
Normally the system displays the component pick-up ratio from the lowest
(worst) ratio to the highest (best) ratio (see Figure 6.2.3.1.6).
Figure 6.2.3.1.6 Ratio of Pick-up screen
(From the lowest (worst) ratio to the highest (best) ratio)
Function of each button
− When you click the <REFLESH> button or <WORST> button, the system
displays data in the worst ratio order: from the lowest ratio to the highest
ratio.
− When you click the <BEST> button, the system displays data in the best ratio
order: from the highest ratio to the lowest ratio.
(3) Updating data
① During production
The system will not update data during production.
When you click the <REFLESH> button, the system updates data, and
displays it in the worst pick-up ratio order: from the lowest to the highest
as shown in Figure 6.2.3.1.6.
② While the system temporarily stops PWB production
The system automatically updates data, and displays data in the worst
pick-up ratio order: from the lowest to the highest as shown in Figure
6.2.3.1.6.