MV-9_Chapter 5. Teaching.pdf - 第24页
MV -9 Use r Manual 5- 24 Color im age ( a ) Default sett i ng ( b ) S area exp ansi on ( c ) H area exp ansi on ( d ) binar i zat i on lowly [Figure 5- 16 Image binarization result by color map adjustment] 3 ) A pplying …
错误!使用“开始”选项卡将 제목 2 应用于要在此处显示的文字。错误!使用“开始”选项卡将 제목 2 应用
于要在此处显示的文字。 .
5-23
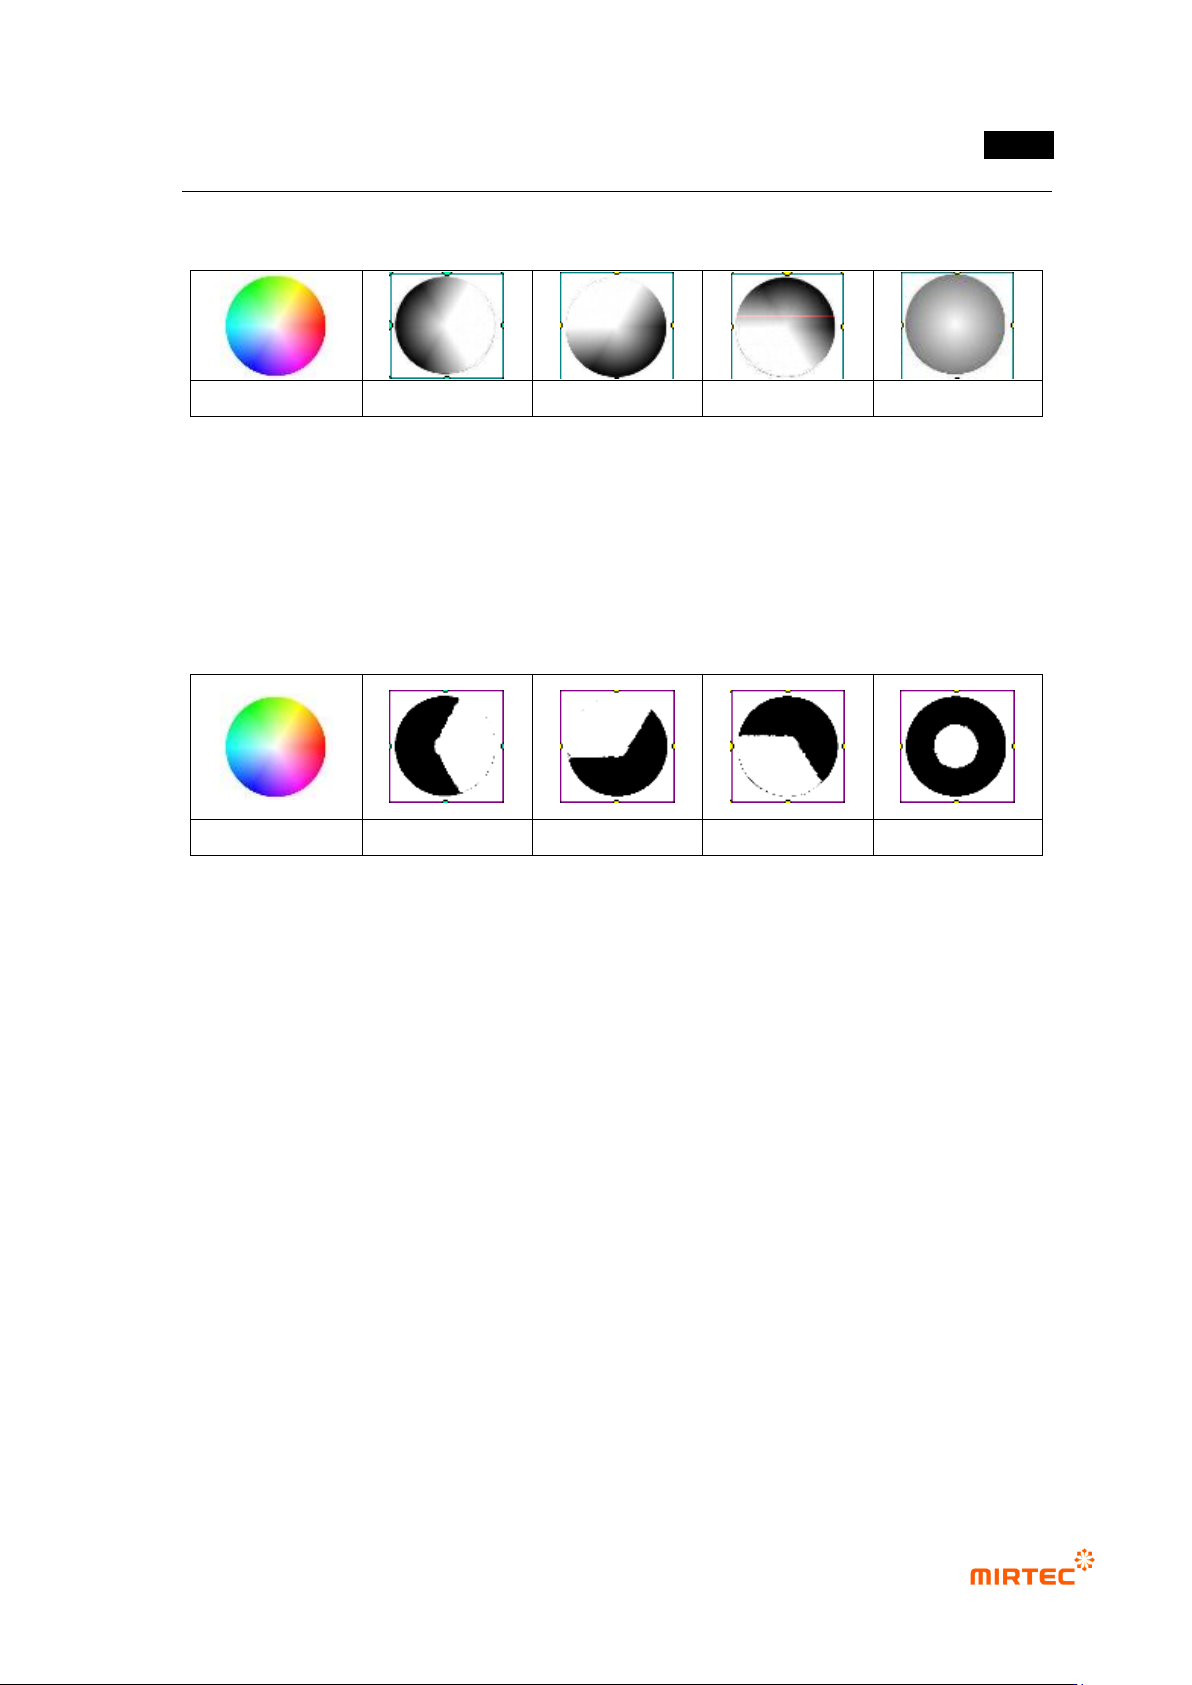
formula. As shown in figure 2-(d), the center of white area appears the brightest, and it gets
dark as it goes outward.
color image
(a) R image
(b) G image
(c) B image
(d) L image
[Figure 5-14 Channel image (1 band) for color image (3 band)]
2) Binarization of color image
Figure 3 shows binarization of each channel image extracted from color image. Figure 3 shows
binarization result with same threshold (200). As shown in [Figure 5-32], only the brightest part is
separated in [Figure 5-31].
(a) color image
(b) R image
(b) G image
(c) B image
(d) L image
[Figure 5-15 Binarization result of each channel image]
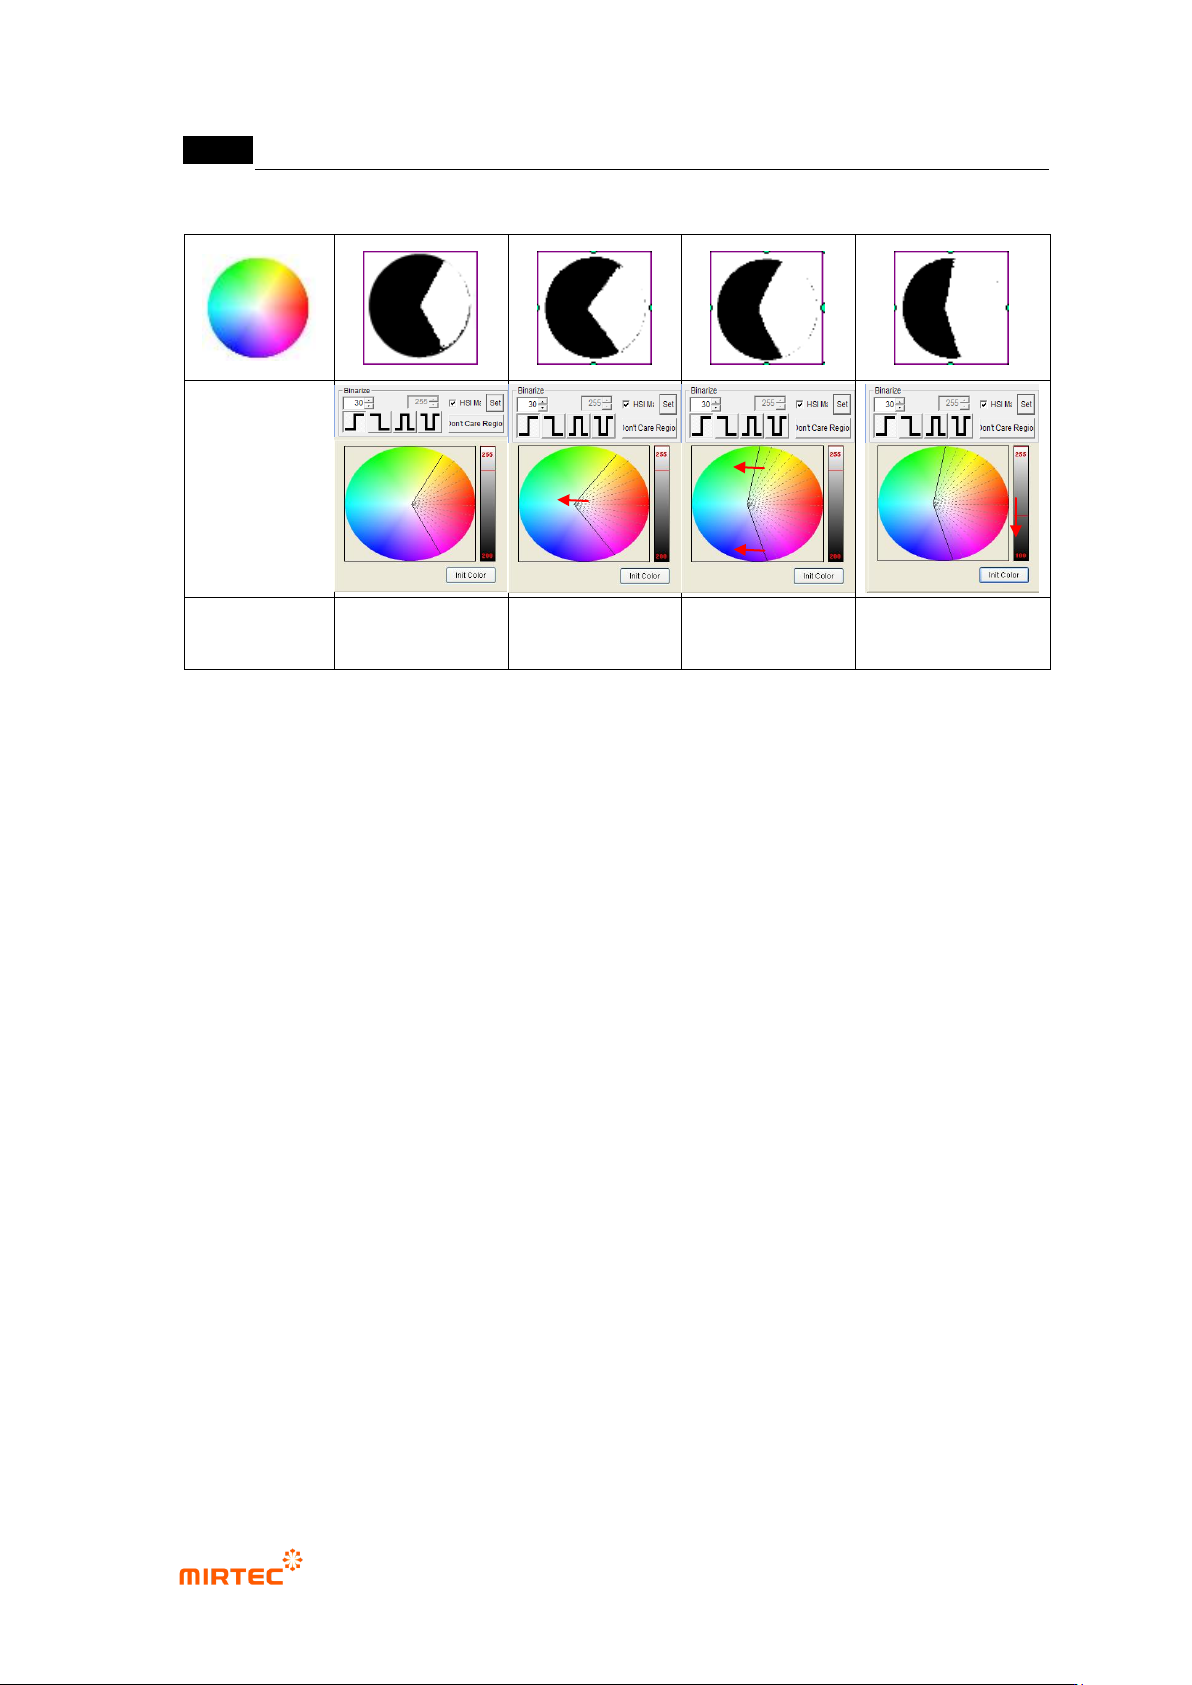
① Binarization shown in [Figure 5-32] can create more useful and various binarization image
as shown in [Figure 5-33] by properly adjusting color map. The following is the characteristic
of each image based on default setting image. [Figure 5-33] color image-image type R
conduct.
② S (Saturation) area expansion: As shown in [Figure 5-33]-(b), if color map is expanded
(Saturation expansion) to white area in the center of color map, adjacent white area and
white area of central part is included for binarization.
③ H (Hue) area expansion: [Figure 5-33]-(c) is result image that expanded H range of Red
area to yellow area and pink area in color map to create gray image and conducted
binarization. It does not reach to expanded area, but yellow, some green, pink and some
violet area are included.
④ Binarization lower: expansion region of binarization image and color map are different in
[Figure 5-33]-(c). This is because of high threshold for binarization. As shown in (d) in
[Figure 5-33], if threshold is lowered, binarization will be conducted to expansion region of
the color map.
MV-9 User Manual
5-24
Color image
(a) Default setting
(b) S area
expansion
(c) H area
expansion
(d) binarization lowly
[Figure 5-16 Image binarization result by color map adjustment]
3) Applying soldering inspection
- As described above, binarization to which color map is applied can be usefully and
effectively used for soldering inspection that includes various color information. Added to
that, normal inspection can be done through correct color extraction using color map, in
other words, characteristic extraction, and efficiency of inspection algorithm can be
maximized.
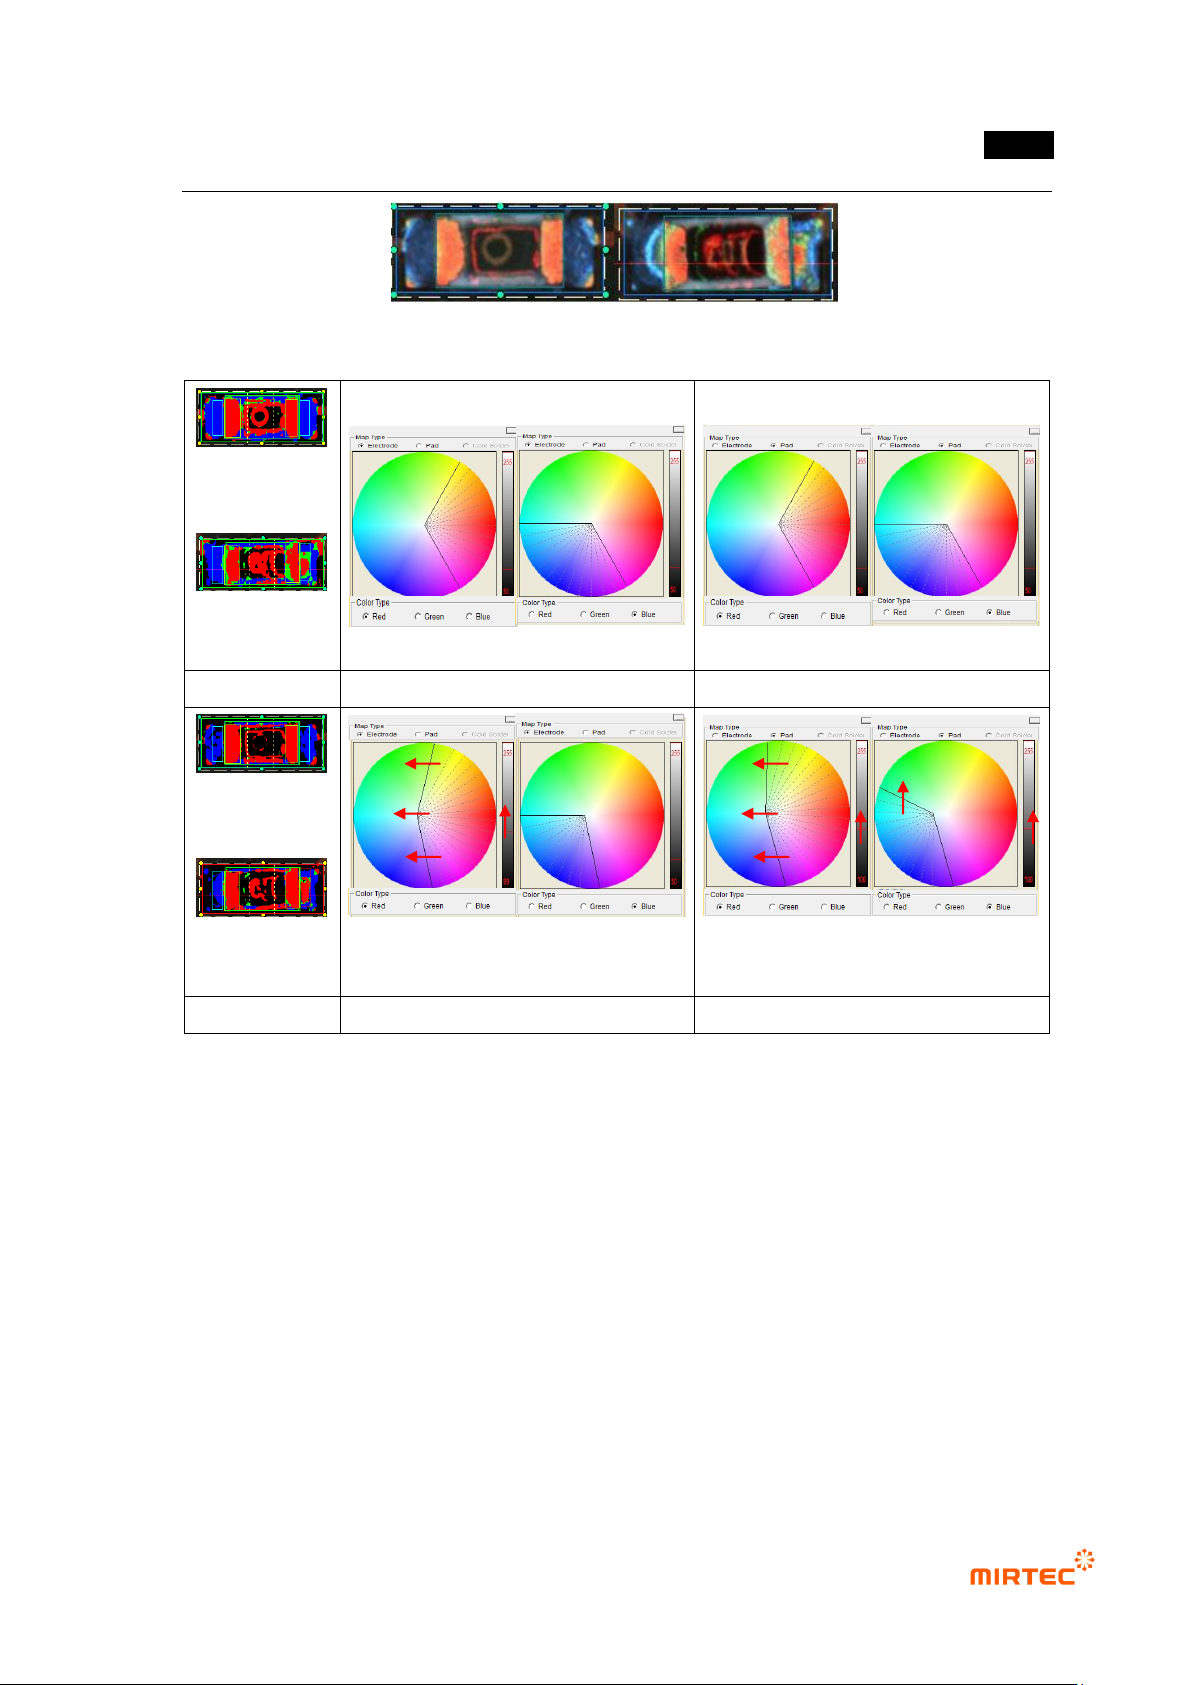
- The following is the color map application to detect lifted defect during chip color
inspection.
① [Figure 5-34] shows example of normal R chip and lifted defect R chip. When we
conduct teaching of chip color inspection window, basic color map of [Figure 5-35]-(a)
will be applied to segment electrode and pad area by color. By conducting trial
inspection, both of 2 chips will be judged as normal by chip color inspection algorithm.
② Red area of area next to right electrode of lifted defect chip must be emphasized to
detect lifted defect. As shown in [Figure 5-34], we can see distribution of red, yellow and
light green in lifted area. Hence, as shown in [Figure 5-35]-(b), we adjust color map to
include color of lifted area in color map. Additionally, set threshold for binarization at
high value to delete unnecessary color area information.
③ As a result, red information of lifted defect area is expanded and judged as defect.
错误!使用“开始”选项卡将 제목 2 应用于要在此处显示的文字。错误!使用“开始”选项卡将 제목 2 应用
于要在此处显示的文字。 .
5-25
[Figure 5-17 Examples of normal chip and lifted chip]
(Judged as
normal)
(Judged as
normal)
(a) normal
Basic electrode color map
Basic pad color map
(Judged as
normal)
(Judged as
defect)
(b) lifted defect
Modified electrode color map
Modified pad color map
[Figure 5-18 Example of modification of color map for lifted detection]