Vision_Serie_EN_2023 - 第20页
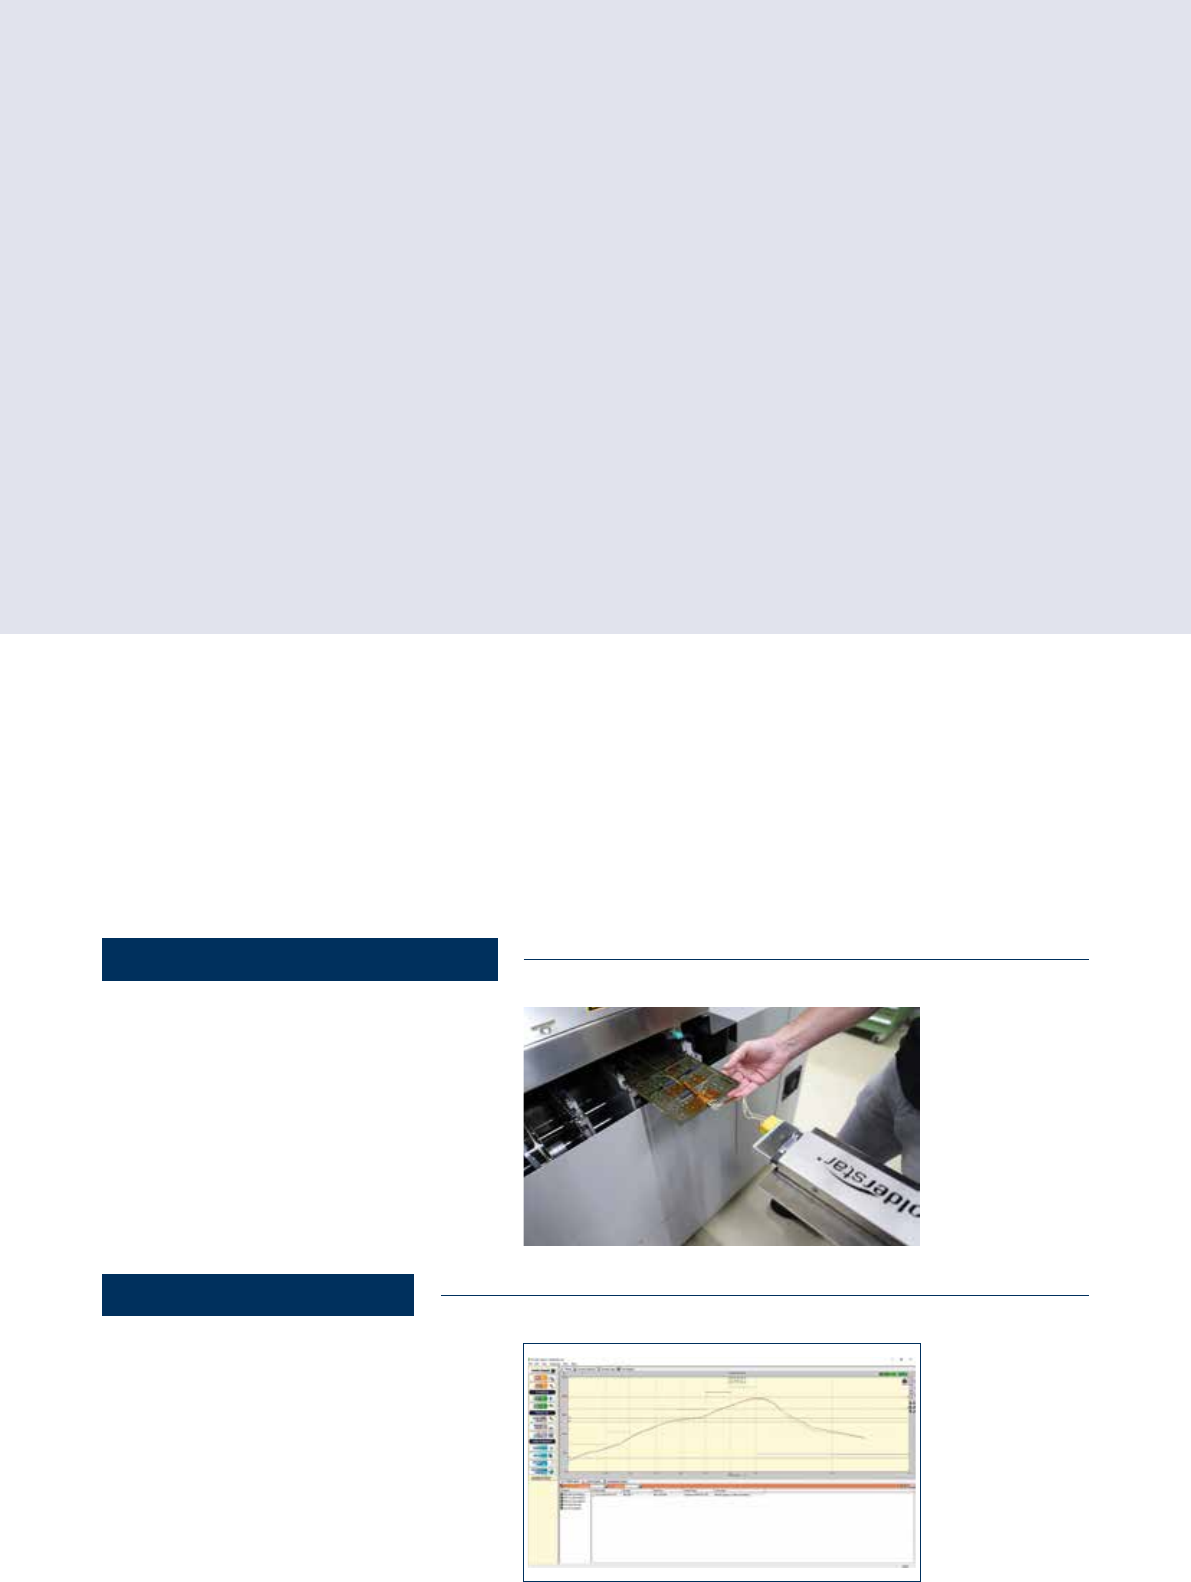
20 Using a data logging device, tempera- tures of the assembly prepared with temperature sensors are recorded. 1. Temperature Data Acquisition 2. Data Expor t The recorded temperatures are im - ported into the ViCON soft…
19
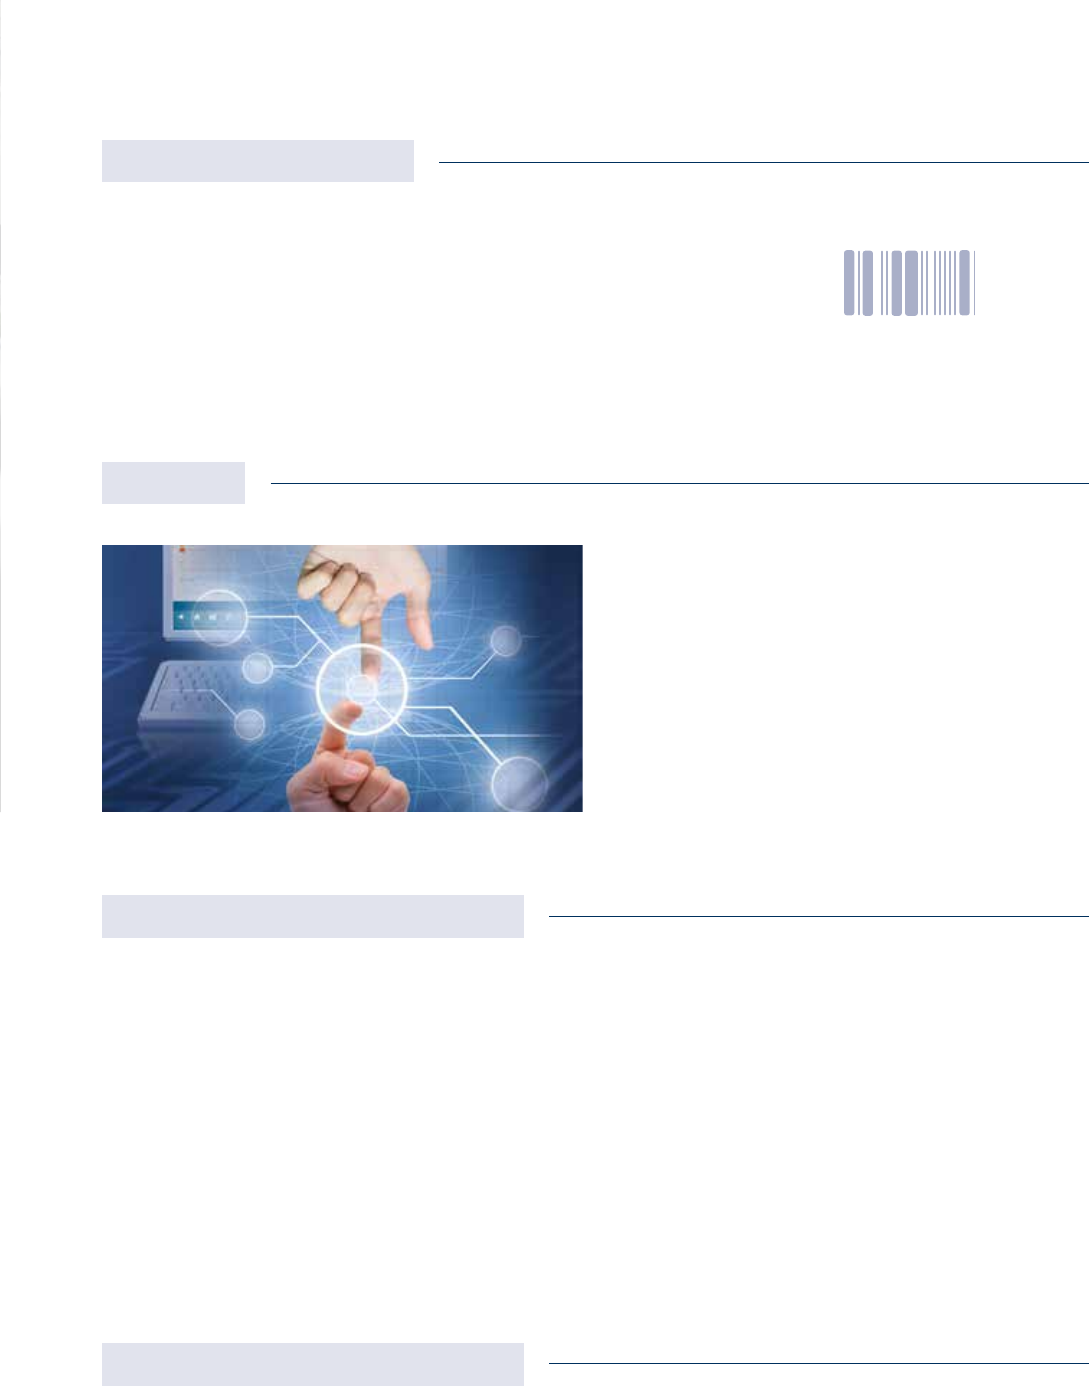
MES connection and ROI
Long-standing experience with MES connections makes it
possible for Rehm to offer an innovative solution for MES
master computer connection which meets every known
requirement of modern MES systems. Communication here
is based on XML logs transmitted via TCPIP. All data relating
to process interlocking, traceability, machine status and other
operating data is exchanged here.
Clearly structured product management ensures in everyday
production that the right reow program is clearly attributed to
the component/item number to be manufactured. Alongside
the oven settings, component-specic data can also be saved
in product management.
Product management
A variety of packages are possible for the VisionX design
series in the eld of traceability and process interlocking:
› Traceability / Process traceability via hand-held
scanner (order-specific)
› Process interlocking via fixed position scanners
› Process interlocking and traceability via fixed
position scanners
A data set containing the relevant process parameters
during the process is generated in a le for each component
as a basis for all packages. Depending on the package, the
components can, using the barcode scan, be identied on the
component directly or using a routing slip scan (by hand or
stationary). If the package contains process interlocking too,
the scan is compared with the database and the component
is only transported into the oven upon release. With the
traceability option, a data set containing the relevant process
parameters during the process is generated in a le for each
soldered component.
Traceability and process interlocking
Optimal
tracking
ProCap
ProCap guarantees the process stability of the reow solder-
ing system for each individual product. The process parame-
ters are automatically stored for the product upon rst start-
up. Every additional order is compared with the parameters
stored for this product. Each individual component is saved
to the ongoing product and order and, where applicable, order
numbers and serial numbers are stored along with these.
Process deviations and operator errors are logged too. Gradual
changes such as, for example, a clogged lter are reliably
detected.
Vision-Series | Industry 4.0
20
Using a data logging device, tempera-
tures of the assembly prepared with
temperature sensors are recorded.
1. Temperature Data Acquisition
2. Data Export
The recorded temperatures are im-
ported into the ViCON software of the
soldering system.
Procedure for
Temperature Proling
Using a data logging device, temperatures of a prepared assembly with temperature sensors
are recorded. Additionally, a reference measurement is conducted with an identical, unpre-
pared assembly. The temperature data captured during the reference measurement are then
linked with the temperature data from the data logger. This enables a prole prediction to be
generated for all subsequent assemblies that pass through the soldering system. This prole
prediction is displayed as an envelope curve graph. If the prole prediction falls outside the
envelope curve, an alarm notication is triggered.
Four Steps to Achieve Your Goal
Easy Envelope Curve Creation
Vision-Series | Profiling
21
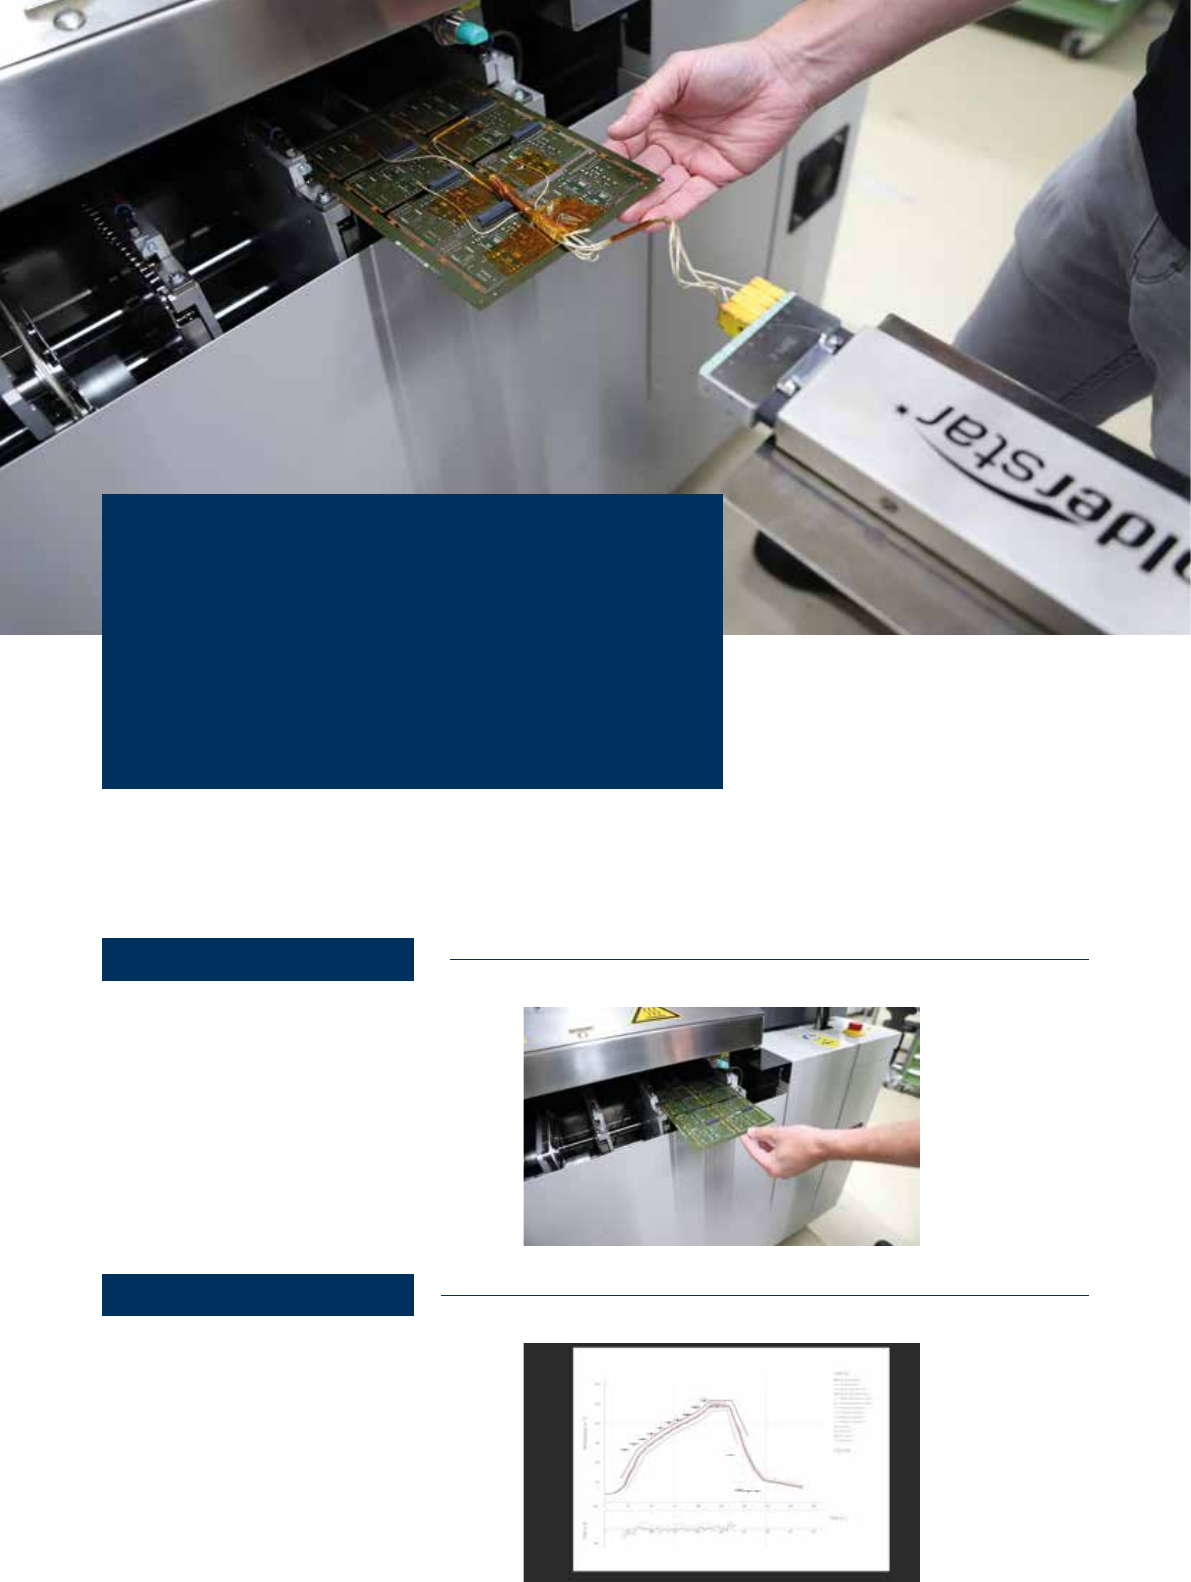
In a reference run with an original as-
sembly, additional time and temperature
data are recorded. This data is provided
by a specialized multi-thermocouple.
3. Reference Run
4. Prole Prediction
For every subsequent assembly that
passes through the soldering system,
a prole prediction is generated in the
form of an envelope curve graph. The
envelope curve must be dened once.
Continuous Monitoring of Your Soldering Process
Steps 1 through 4 need to be performed only once for each assembly.
When the program is loaded and ProMetrics is activated, every assem-
bly is subsequently monitored within an envelope curve graph.
If the prole prediction exceeds the upper or lower limit of the envelope
curve, an alarm notication is triggered. The calculated PWI value is
responsible for this prole prediction alarm
Vision-Series | Profiling