OperationInstruction_Vsision XP - 第175页
V ISION XP+ V AC Page 167 6 Rehm Recorder 6.3 Chart Operating Instructions V ersion 1.5 6.3.6 C alculate gradient When recordi ng has been paused , clicking the " Ad d Gradient " button en- ables a gra dient to…

Page 166 VISION XP+ VAC
6 Rehm Recorder
6.3 Chart
Operating Instructions
Version 1.5
6.3.3 Selected data point value
The "selected" value is understood to be the value shown by the vertical
dotted line. This line moves with the current data point.
Moving the cursor into the chart causes the line to jump to the cursor and the
data for the current position to be shown. You must move the cursor out of
the chart area if you want to display the current data point again.
The value "selected" is displayed for all data points configured and activat-
ed.
6.3.4 Zoom chart
Keeping the left mouse button pressed opens a zoom window that zooms
the selected area onto the full chart window.
6.3.5 Move chart
Keeping the right mouse button pressed enables the chart to be moved in all
directions.
VISION XP+ VAC Page 167
6 Rehm Recorder
6.3 Chart
Operating Instructions
Version 1.5
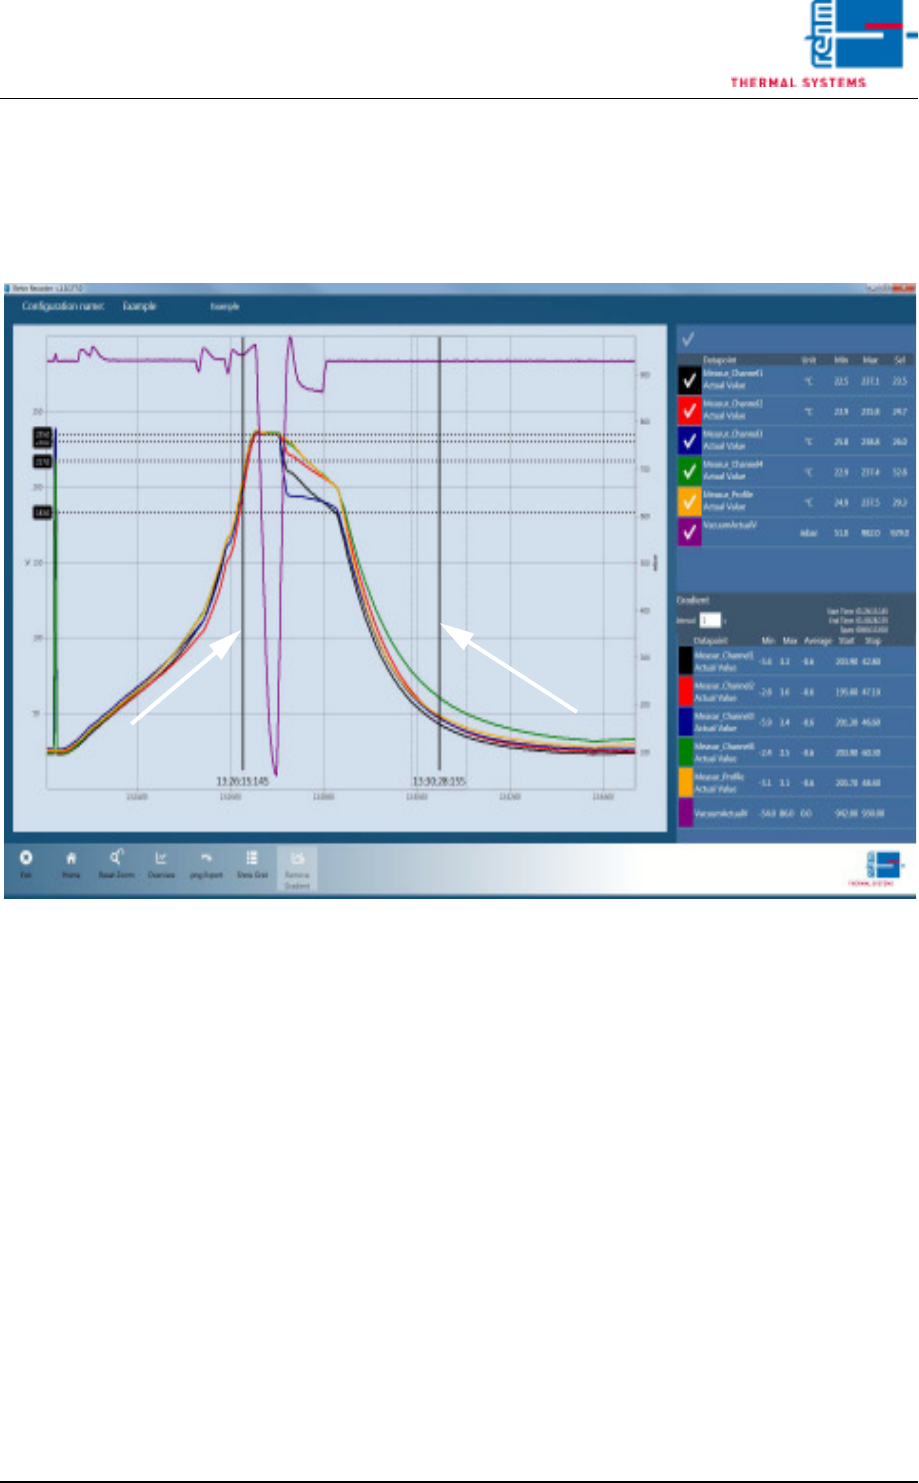
6.3.6 Calculate gradient
When recording has been paused, clicking the "Add Gradient" button en-
ables a gradient to be plotted.
Fig. 6-20 Calculate gradient
For this, two black bars are shown that can be moved to the correct position
on the chart with the mouse.
The values calculated are then shown in the legend under "Gradient". An
"interval" (in seconds) during which the gradient is calculated can be set in
addition.
6.3.7 Close chart legend
Re-clicking the right arrow (">") in the legend collapses the legend.
Page 168 VISION XP+ VAC
6 Rehm Recorder
6.4 File mode
Operating Instructions
Version 1.5
6.4 File mode
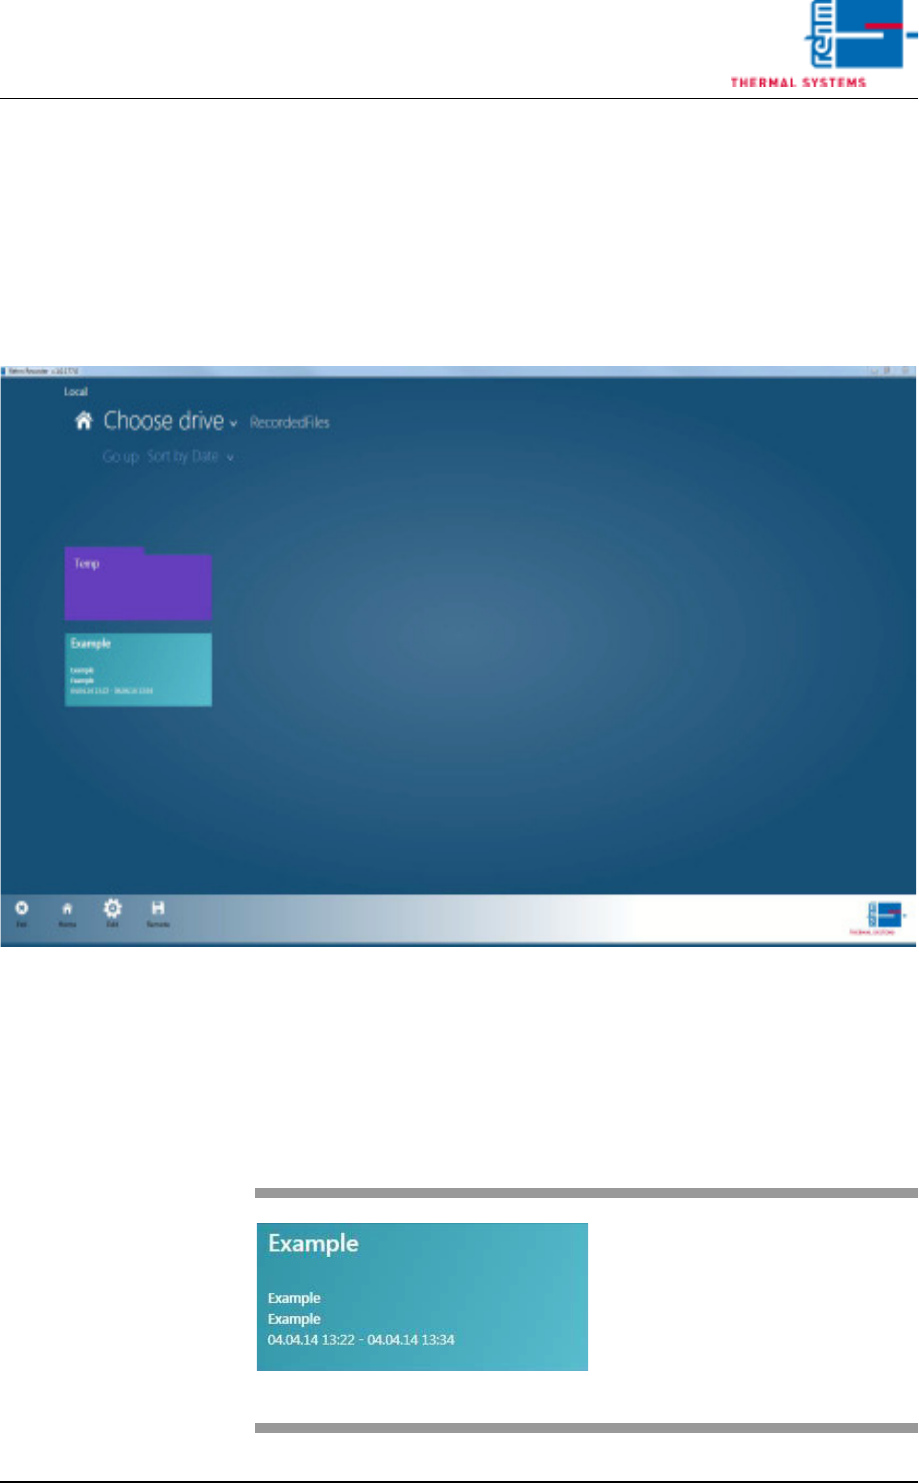
6.4.1 Select file
Clicking the "File mode" tile in the start menu takes the user to the selection
of records already recorded.
Fig. 6-21 Select file
Move this view by keeping the left mouse button pressed whilst moving left,
or by swiping over the screen from right to left with your finger.
6.4.2 Record
Fig. 6-22 Record
Clicking one of the turquoise-co-
loured tiles loads the record select-
ed in the chart.