SiplaceX4_en.pdf - 第665页
Edition 09/2005 SIPLACE X Appendix 10 20.3.3 Assessing the Axis Dynamic Si gnal (also for ’Beginner ’Mode) The SIPLACE Axis T ester uses t he (signal) optio n 1 menu as a default for displaying axis dynamic signals. T o …
SIPLACE X Edition 09/2005
Appendix
9
Test the Zero pulses of the incemental encoder system over the whole travel range ’reference
error’ 20
After activating the reference error menu the position counter is permanently active so the manu-
ally moved distance will be counted to. The Zero pulses are only counted at the automatic posi-
tioning to back to the programmed position (Zeropoint count between Start and End signal).
The count pulses before the first Zero pulse and after the last Zeropulse are counted and titled as
’Error per Zeropulse’.
These are not count errors.
Alternatively to the manuell movement of the axis and the automatic scrolling back for the mea-
surement you can also run a continous run for a Tracksignal and zero pulse check. Therefore run
a positioning over the full travel range with more then 2 seconds waiting time at each position. So
you are able to ’start for measurement’ at one position and stop the measurement at the other po-
sition. After stop the result is displayed. If you run continus run for multiple distances the Zero
pulse counter count on; the position counter count positive and negative according the moving di-
rection.
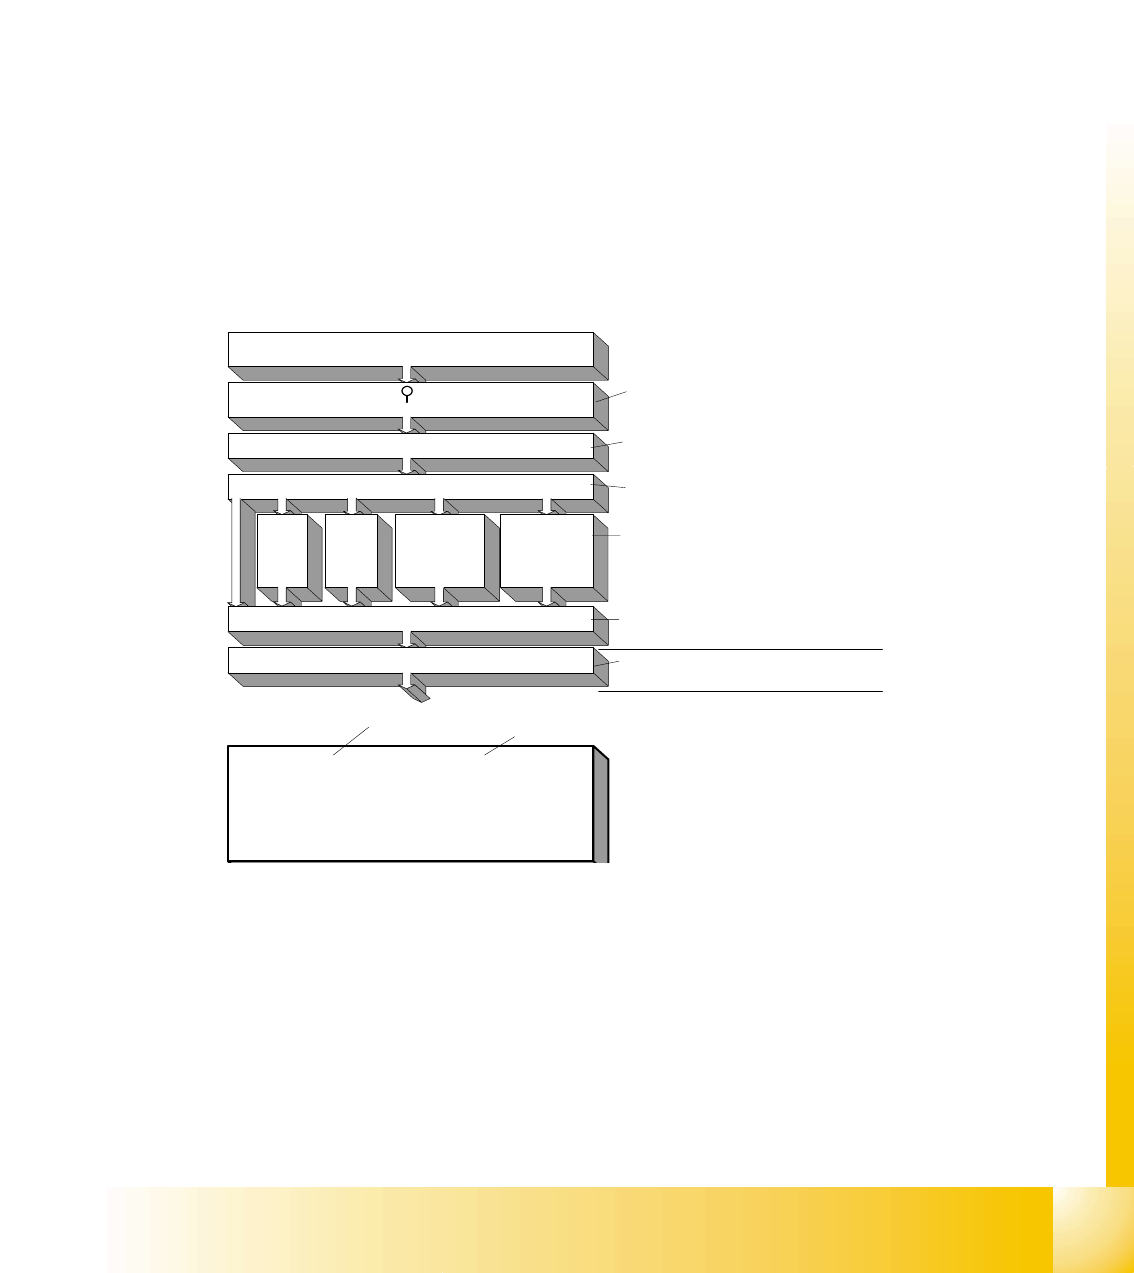
20.3.2.3 Displaying the Axis Position
The position of any
axis can be shown
with the ’Serial con-
nection’ menu.
Fig. 20.3 - 5 Sequence
of steps for displaying
the axis position
Connect the SIPLACE Axis Tester SAT to the
respective Axis controller board
Boot the SAT and press ' ' to activate main menu
Select the 'Machine' (Platform)
Selection of: C- / HF- / S- or F- or HS-Machine
HF on top/S-Type/
F-Type/HS-Type at bottom
with Cursor up/down & confirm with
'return' <-
|
The menu 'back' ('quit') returns back to
the previous menu level
HF .
HF/3
HF/4
(F
3
*) top
F
4
/ F
5
/
F
5
HM
(WPC*) bot
CS
CF
(G/S15*)
S20/
(S23)S25H
M / S27HM
Select the desired axis type
with Cursor up/down and left/right
and confirm with 'return' <-
|
Select menu 'serial connect'
749994 | Axis is referenced
| FW has disabled Servo
| Zero impulse not reached
| Machine data is valid
| Servo by switch enabled
| V24 Terminal isn't active
| Pos. data valid
to get the Axis position and Axis controller
state
Axis position and Axis controller state
with Cursor up/down and
confirm with 'return' <-
|
* adapter f. Axis c. necessary
Edition 09/2005 SIPLACE X
Appendix
10
20.3.3 Assessing the Axis Dynamic Signal (also for ’Beginner’Mode)
The SIPLACE Axis Tester uses the (signal) option 1 menu as a default for displaying axis dynamic
signals. To reconfigure this setting please refer to Fig. 20.3 - 1, Chapter 20.3.2.1.
Adjusting the
tacho: The ta-
cho signal is di-
rectly
connected
from the servo/
adjustment
board pins to
the oscillo-
scope input.
Assessing the
positioning
quality:
Measuring the
traversing
time/over-
shoots.
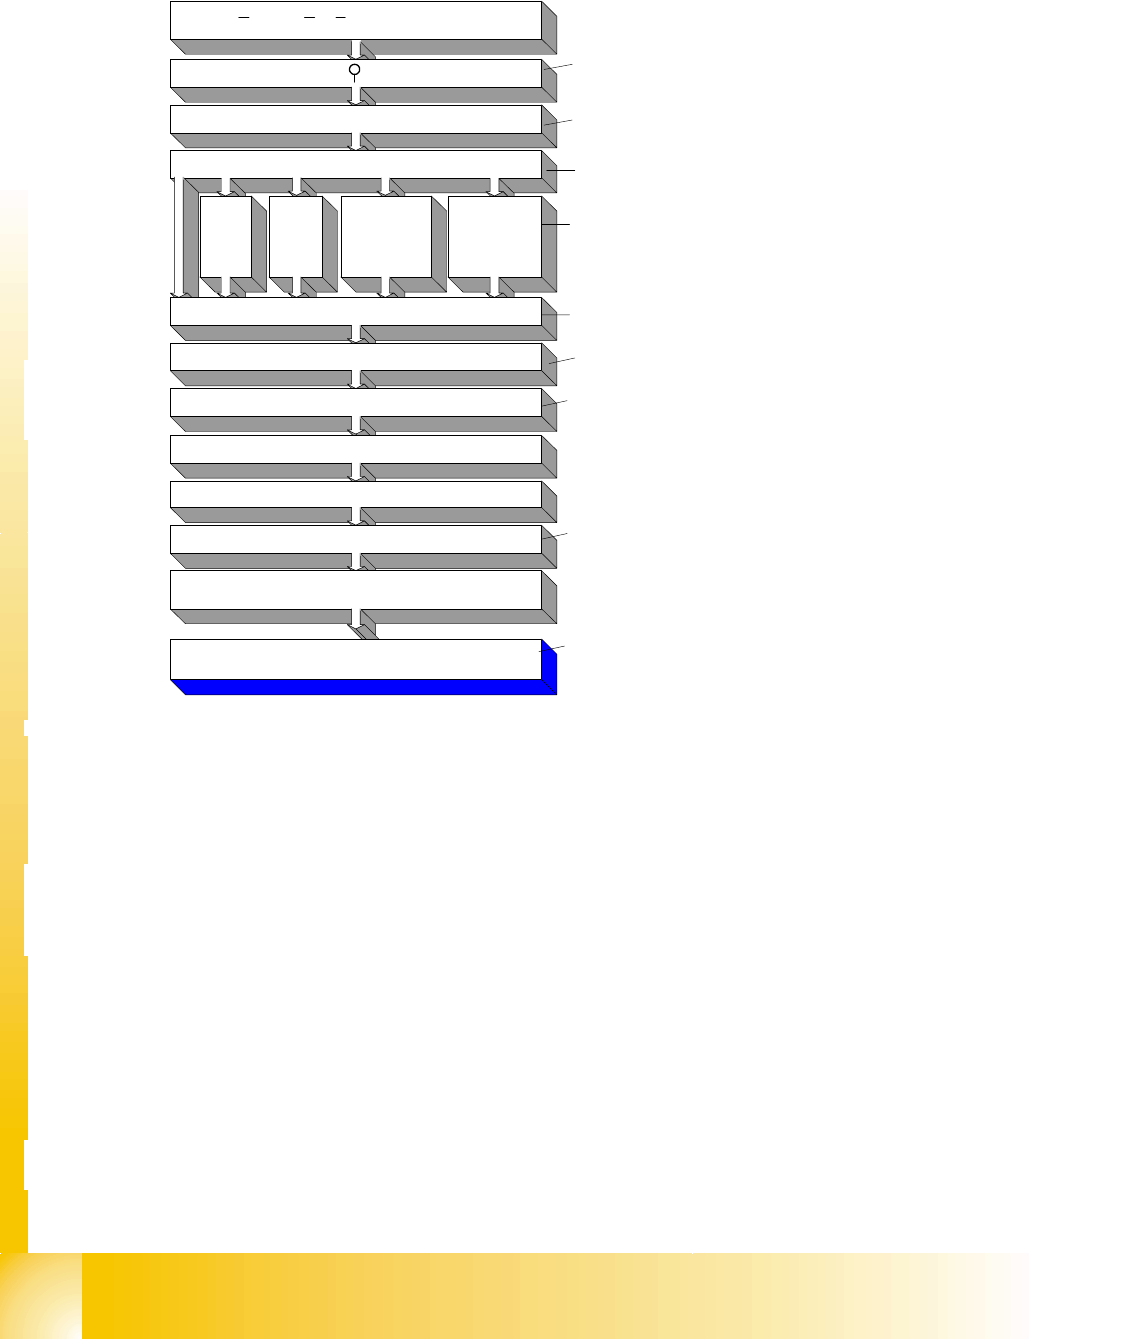
Fig. 20.3 - 6 SAT’ operating sequence
The sequence of steps for setting the axis dynamic depends on the operating sequence and con-
nection descriptions for the relevant machine type.
20.3.3.1 Default Terminal Assignment of SAT BNC Outputs for Assessment of Dynamics
– V
nom
. is emitted at the SAT BNC output 1.
– SAT BNC output 2 supplies the nominal current for an AC axis with
Vreg (uncommuted current
signal). However, this is only connected for AC star axes with full digital control. The oscillo-
scope input CH3 can be used for this
Vreg signal. For both DC (Z, DP) and "analog AC"(X,Y)
axes CH3 is free for
I
actual
servo current signals.
–A
I
nom
signal (force output at axis controller/at the axis test box) is provided at BNC output 3.
This is the additional acceleration signal for the gantry axes or the force limitation signal for the
Z-axis.
– A connection for the
end signal is provided at SAT BNC output 4. This signal is generally used
as a trigger signal (exeption Z-Axes).
connect SIPLACE Axis Tester SAT to respective Axis
controller board
Boot the SAT and press to activate Main menue
Select 'Machine' (platform)
Selection from: C- / HF- / S- or F- or HS-Machine
HF on top/S-Types/
F-Types/HS-Types at bottom
with cursors up/down
and confirm <-
|
The menu 'back'(quit) returns
back to the previous menu
HF .
HF/3
HF/4
(F3*) top
F4 / F5 /
F5 HM
(WPC*) bot
CS
CF
(G/S15*)top
S20/
(S23)S25H
M / S27HM
Select Axis type
with cursors up/down or
left/ right and confirm <-
|
Select menu 'adjust Panel'
to get the Axis dynamic signals of the re-
spect. Axiscontroller to the BNC-connectors
Select 'Positioning quality'
after the first positioning press 'return' <-
|
to get ...
Select 'Oscilloscope-mode'
Select 'Signal line e.g. 3'
press 'return <-
|
again and select 'back' up to the new
menu you want
you get the signals at the BNC
outputs and the deviation of position
and time analysis at the SAT screen
For an axis on a different axis controller board -dis-
connect and select the meus described above again
.... get the signals and the deviation
of position at the BNC outputs
with cursors up/down
and confirm <-
|
* adapter f. Axis c. necessary
to connect SAT easier to the same axis control
-
ler type this last AC-test menu is saved.
SIPLACE X Edition 09/2005
Appendix
11
– The deviation of position signal of the respective Axes are (without any further action) dis-
played and analysed on the SAT LCD-Display.
The
Positioning time is the ’whole travel time of a positioning’ (Start signal to End signal).
The
Control time is the time from start to the first arrival at the target position.
The
Pull off Time is the time to control the generated overshoots down to limits.
Positioning time = Control time + Pull OFF time
– With ’Return’ <
_|
, ’Oscilloscope-Mode’, and ’Signal line (2 or) 3’ we connect the deviation of
position signal of the respective Axis to the SAT BNC output. We can measure with the free
Osci-input CH2 (CH3) the deviation of position signal synchronous to the other dynamic sig-
nals.
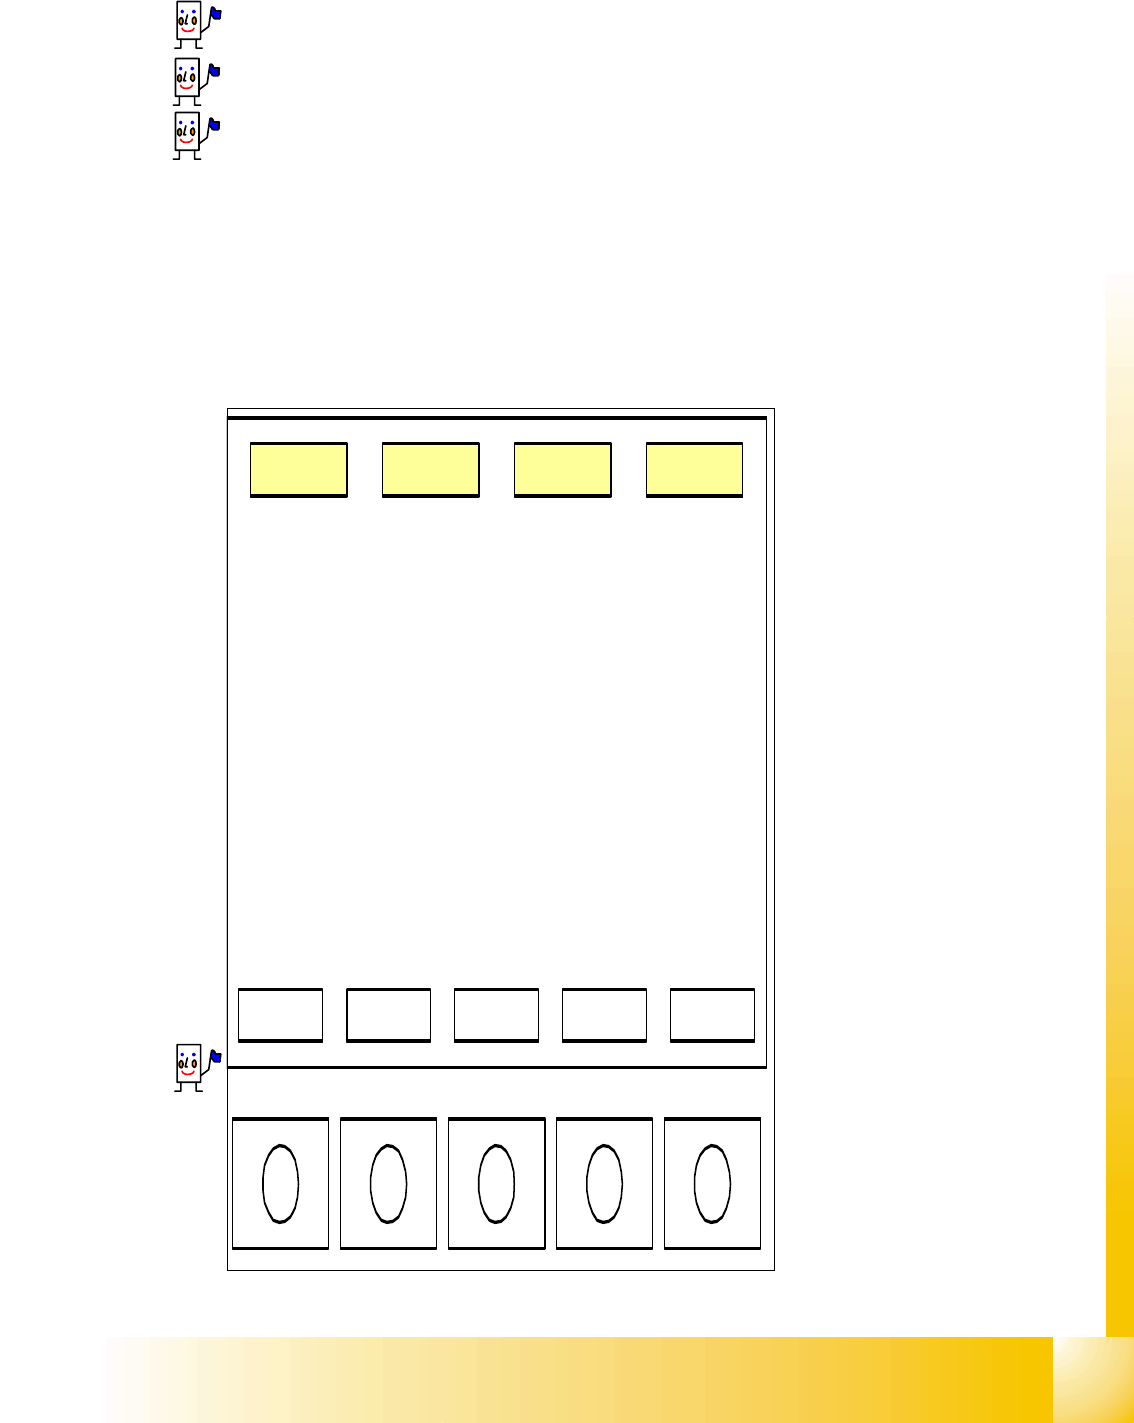
20.3.3.2 SIPLACE Axis Tester ’SAT’ Display
The diagram in the SAT display
shows a typical overshoot (as in
Fig. 20.3 - 7 at the top) and the
corresponding analysis
times.The delays between posi-
tionings should be set long
enough to allow the values to be
read and assessed.
Confirm with <
_|
and select ’PWM
mode’ and ’dynamic’ to display
the position deviation signal on
the oscilloscope. If no overshoot
occurs during the positioning pro-
cess (see Fig. 20.3 - 7 at the bot-
tom) (asymptotic approach), the
positioning time (pos) and the
control time (CTRL) will be
switched simultaneously. There
is therefore no
’pull off time’
(pull off)
during which the over-
shoot is corrected.
PLEASE NOTE:
The display is automatically
scaled to the overshoot size and
time!
Fig. 20.3 - 7 Times and position devia-
tions for a positioning process with/with-
out overshoot
B1 B2 B3 B4 B5