SIGMA_brochure-complete-En-Rev02-2017-12_LD - 第3页
review your process in 3D optimize your line inspection strategy analyze your process at a glance
view your process in real-time
import your data
optimize your line inspection strategy
analyze your process at a glance
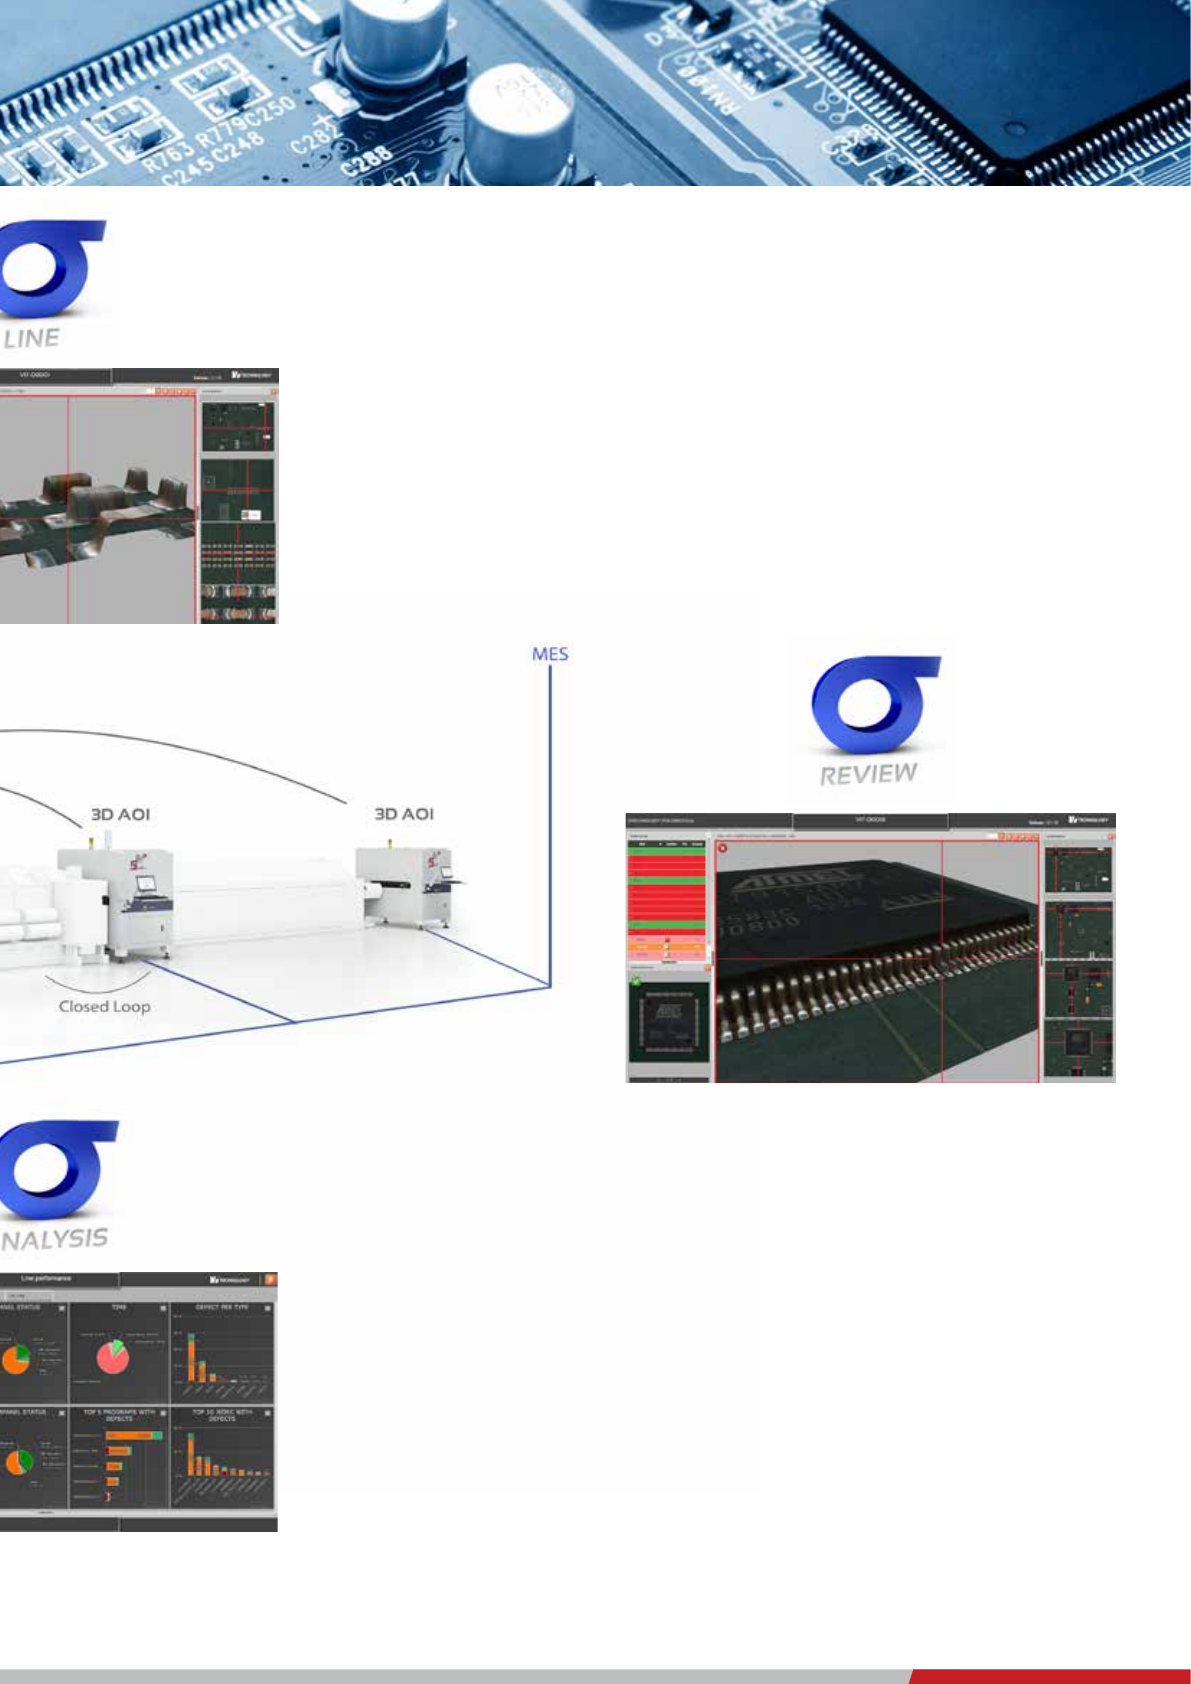
review your process in 3D
optimize your line inspection strategy
analyze your process at a glance
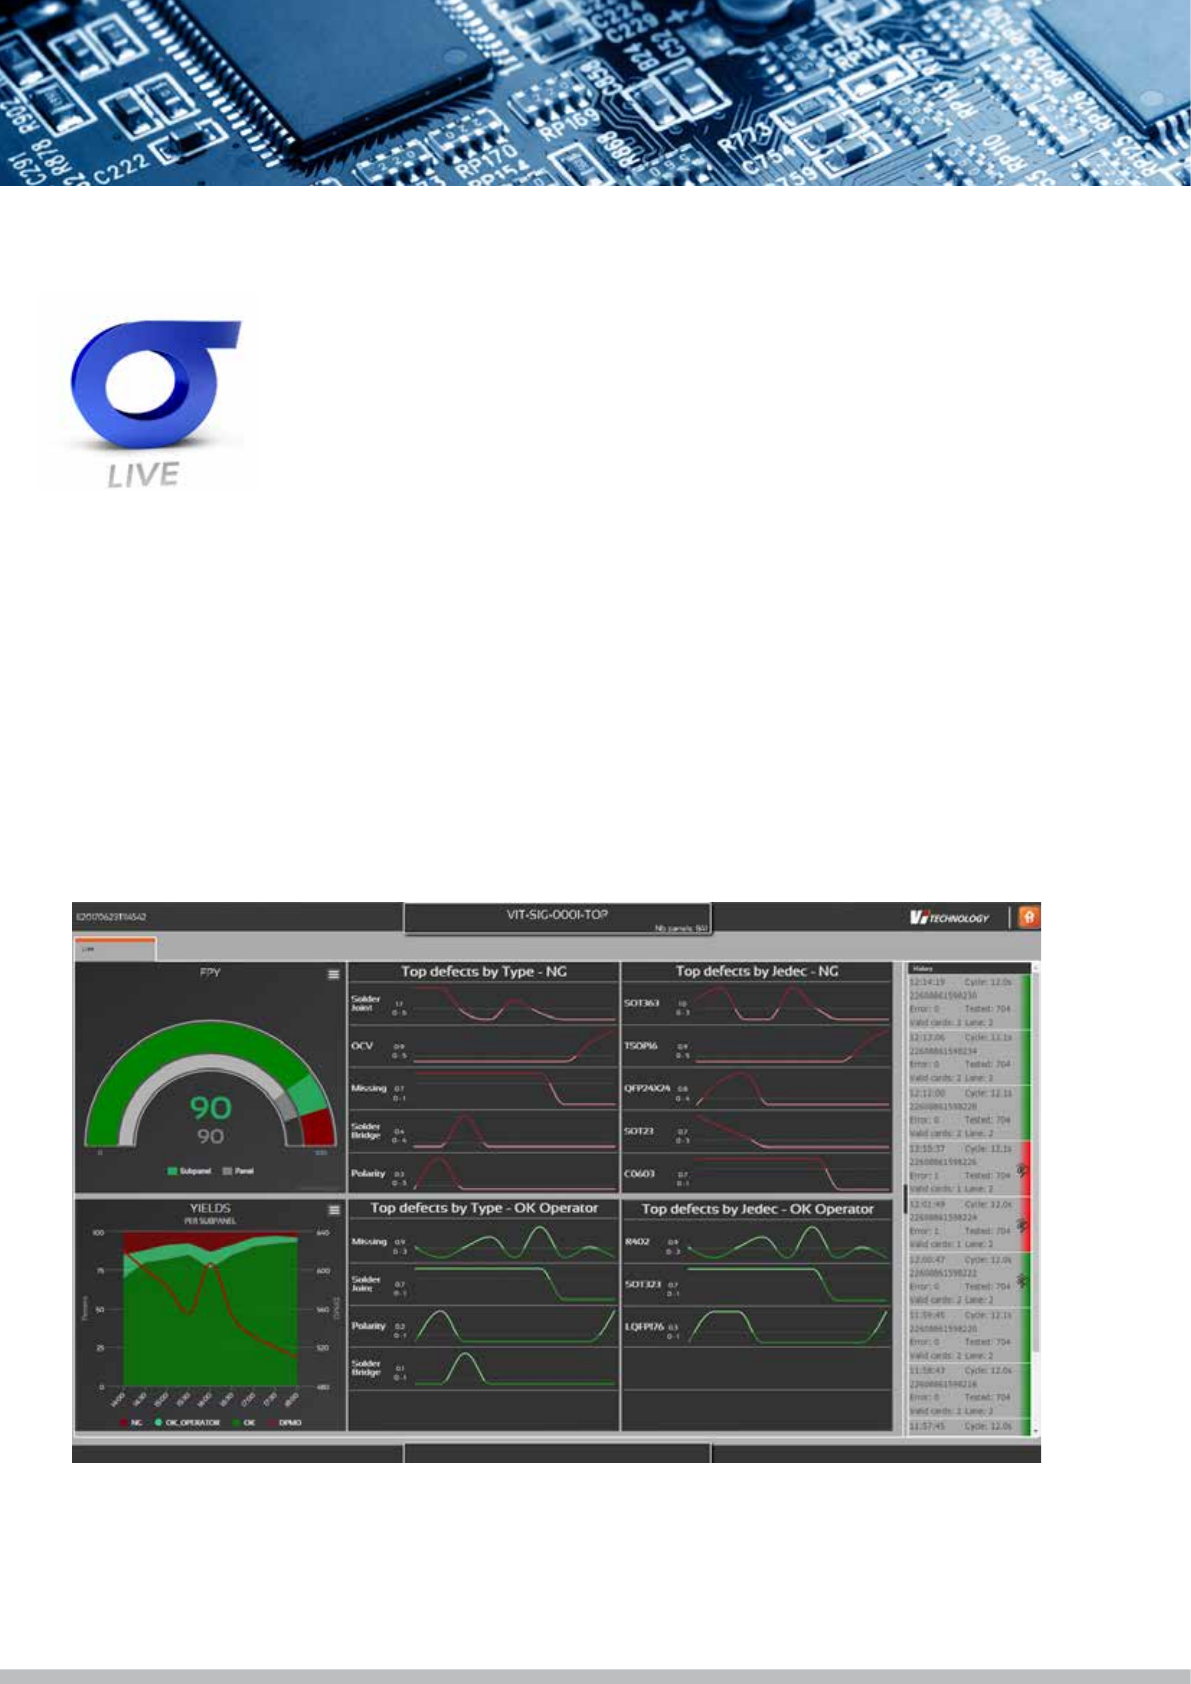
View your process
in real time
Eye catching and intuitive process status to drive quick corrective
action in real time.
Key process indicators at SPI (s-401) or AOI (s-402) can be viewed
anywhere in the plant (web-based) or on any mobile device
• DPMO trends
• FPY
• Top defect trend lines
• Scatter charts, …
“FPY is improving but two issues are revealed by trend charts : bad component reference loaded in
placement machine (OCV) and unstable polarity check on LQFP176 component”