SIGMA_brochure-complete-En-Rev02-2017-12_LD - 第5页
Analyze your process at a glance Go straight to the point to identify recurrent process detractors • Drill do wn in tera bytes of SPI (s-403) or AOI (s-404) data and images to analyze root cause • Monitor process capabil…
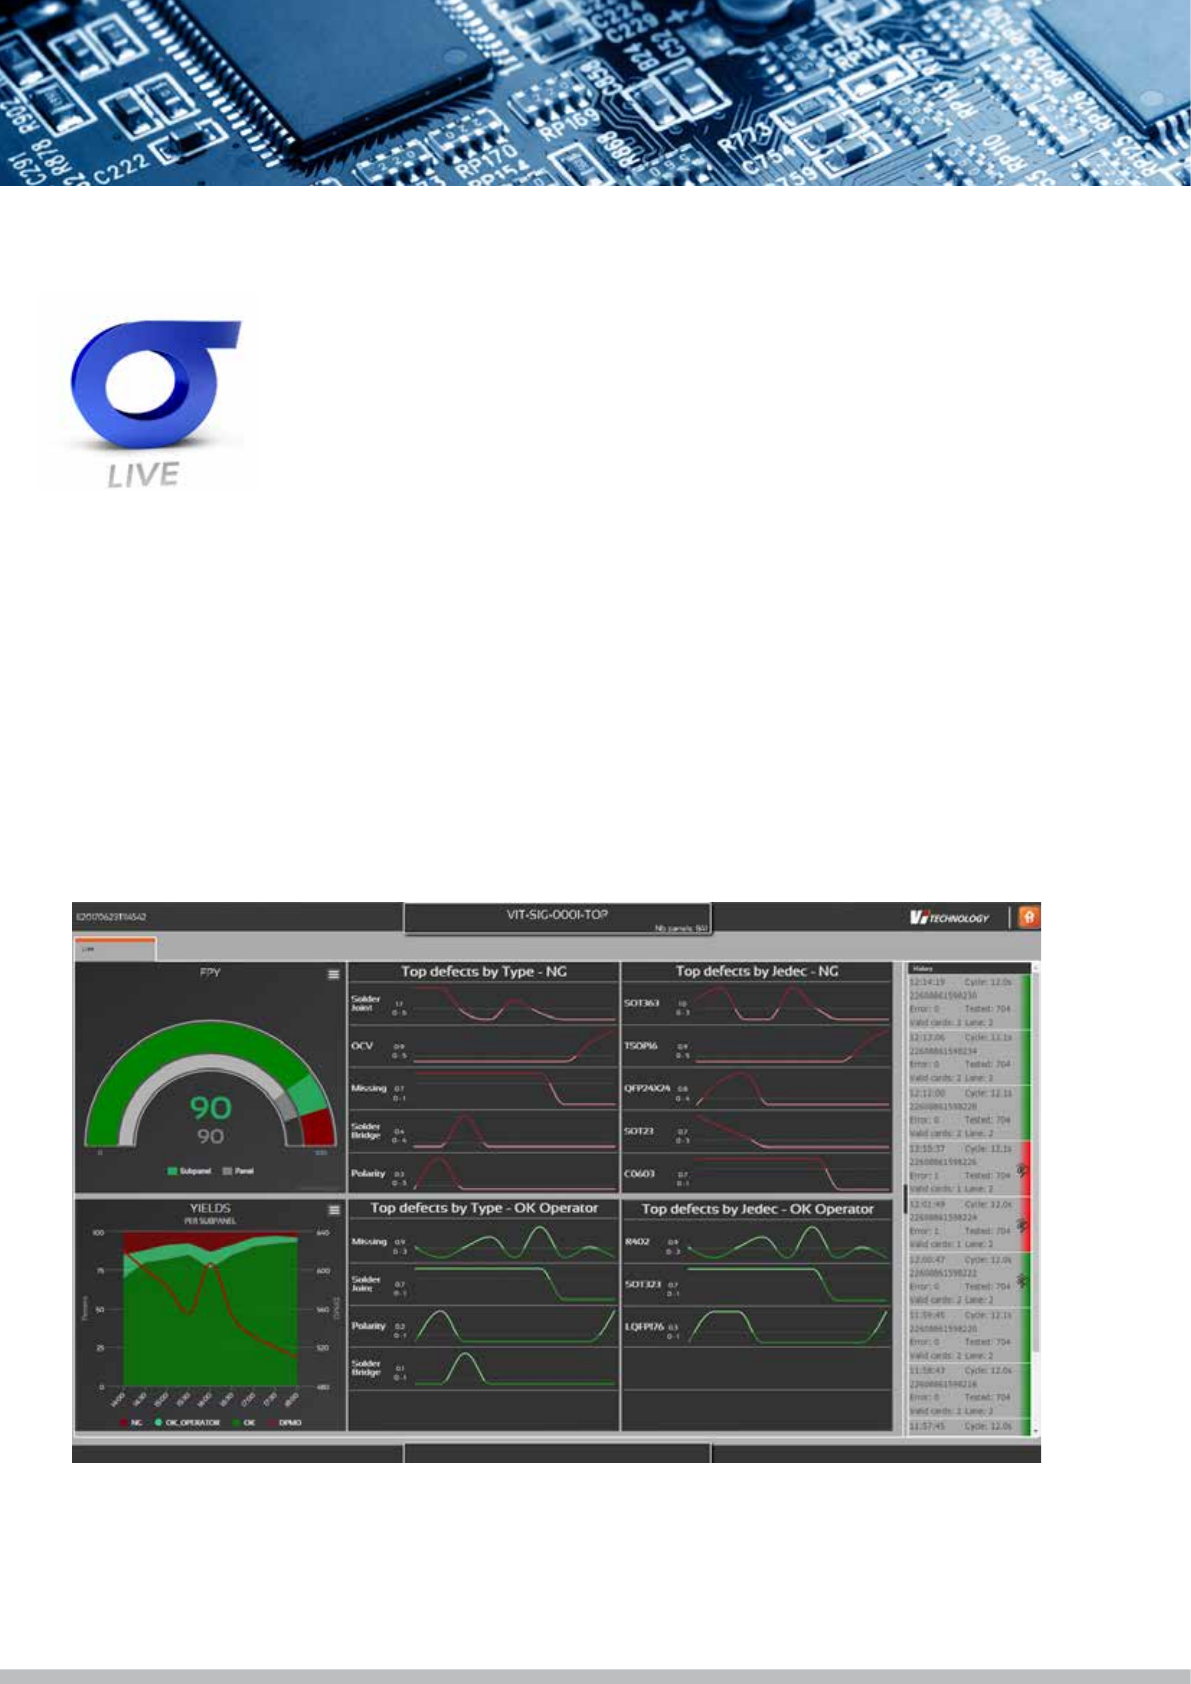
View your process
in real time
Eye catching and intuitive process status to drive quick corrective
action in real time.
Key process indicators at SPI (s-401) or AOI (s-402) can be viewed
anywhere in the plant (web-based) or on any mobile device
• DPMO trends
• FPY
• Top defect trend lines
• Scatter charts, …
“FPY is improving but two issues are revealed by trend charts : bad component reference loaded in
placement machine (OCV) and unstable polarity check on LQFP176 component”
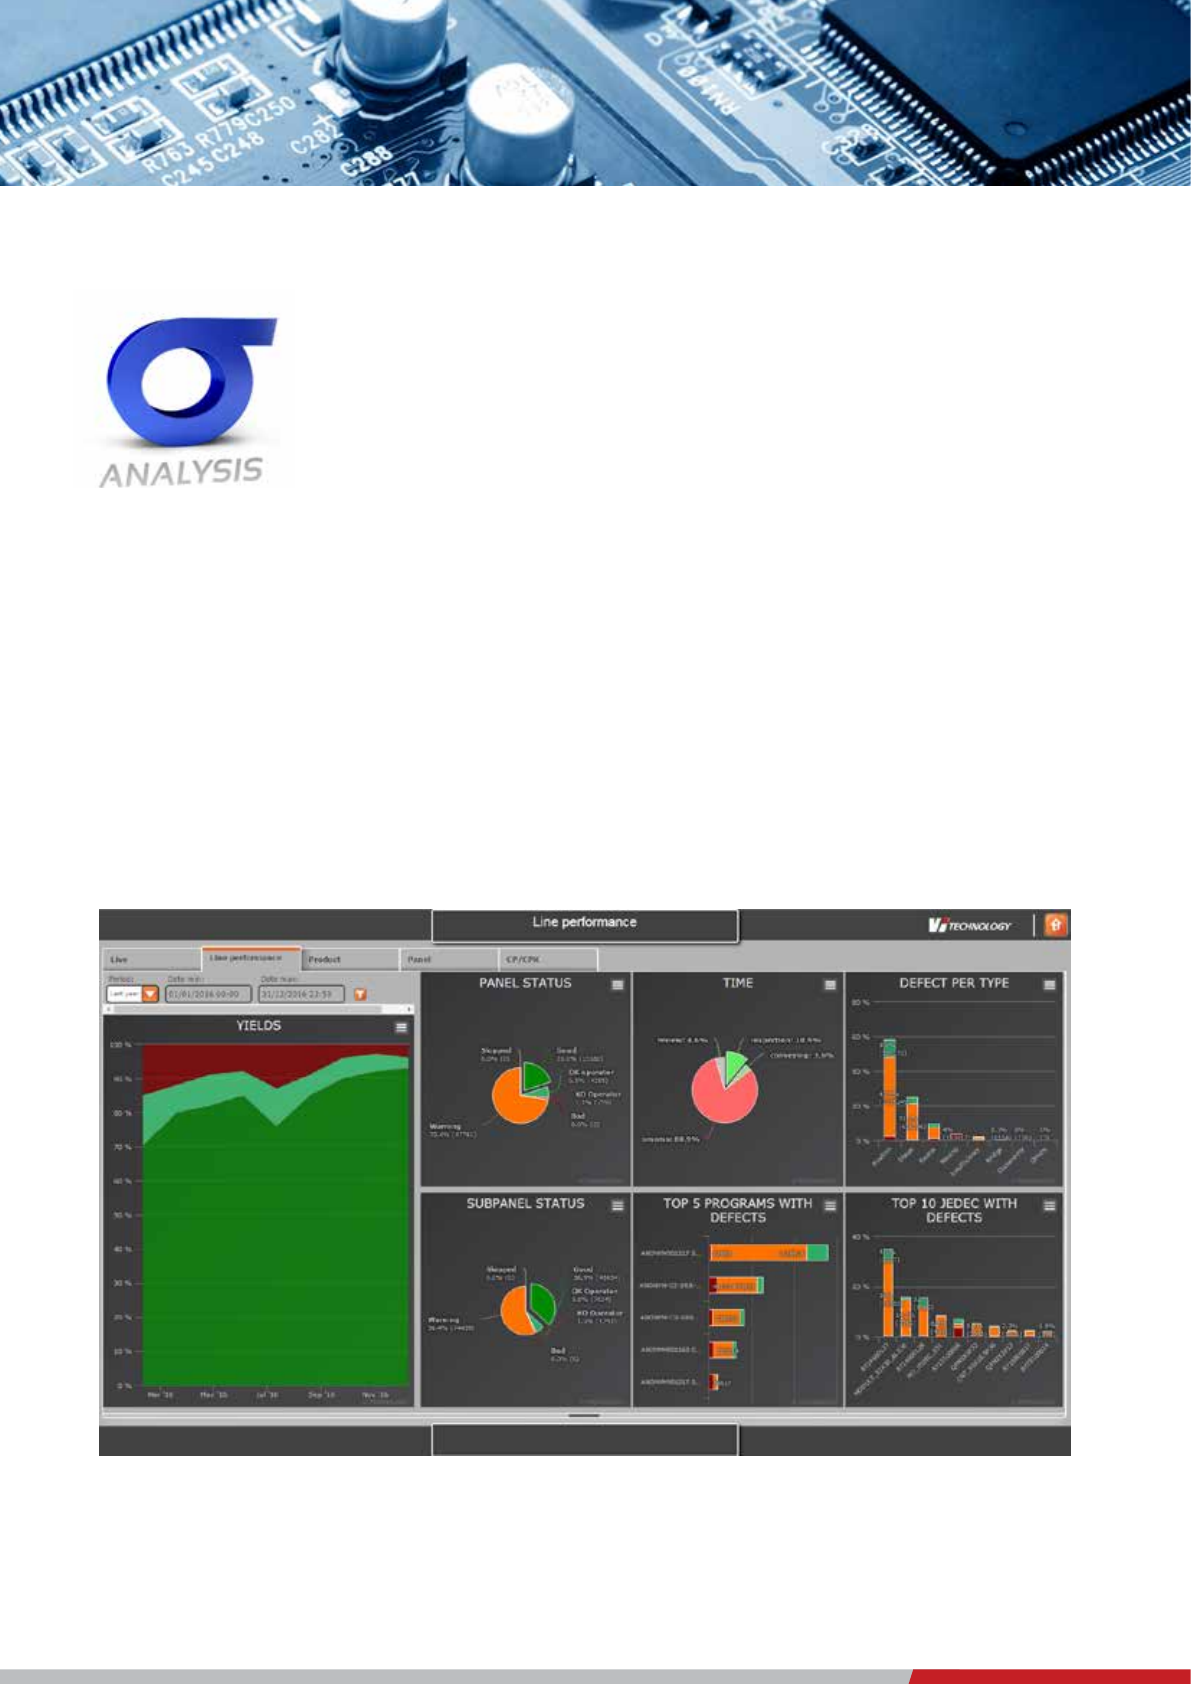
Analyze your
process at a glance
Go straight to the point to identify recurrent process detractors
• Drill down in tera bytes of SPI (s-403) or AOI (s-404) data and
images to analyze root cause
• Monitor process capabilities
• Generate regular quality reports (daily, weekly, monthly, …) to
support 8D problem solving and lean initiatives.
“Print process quality has improved over the period but excessive warnings show
we are operating close to process limits”
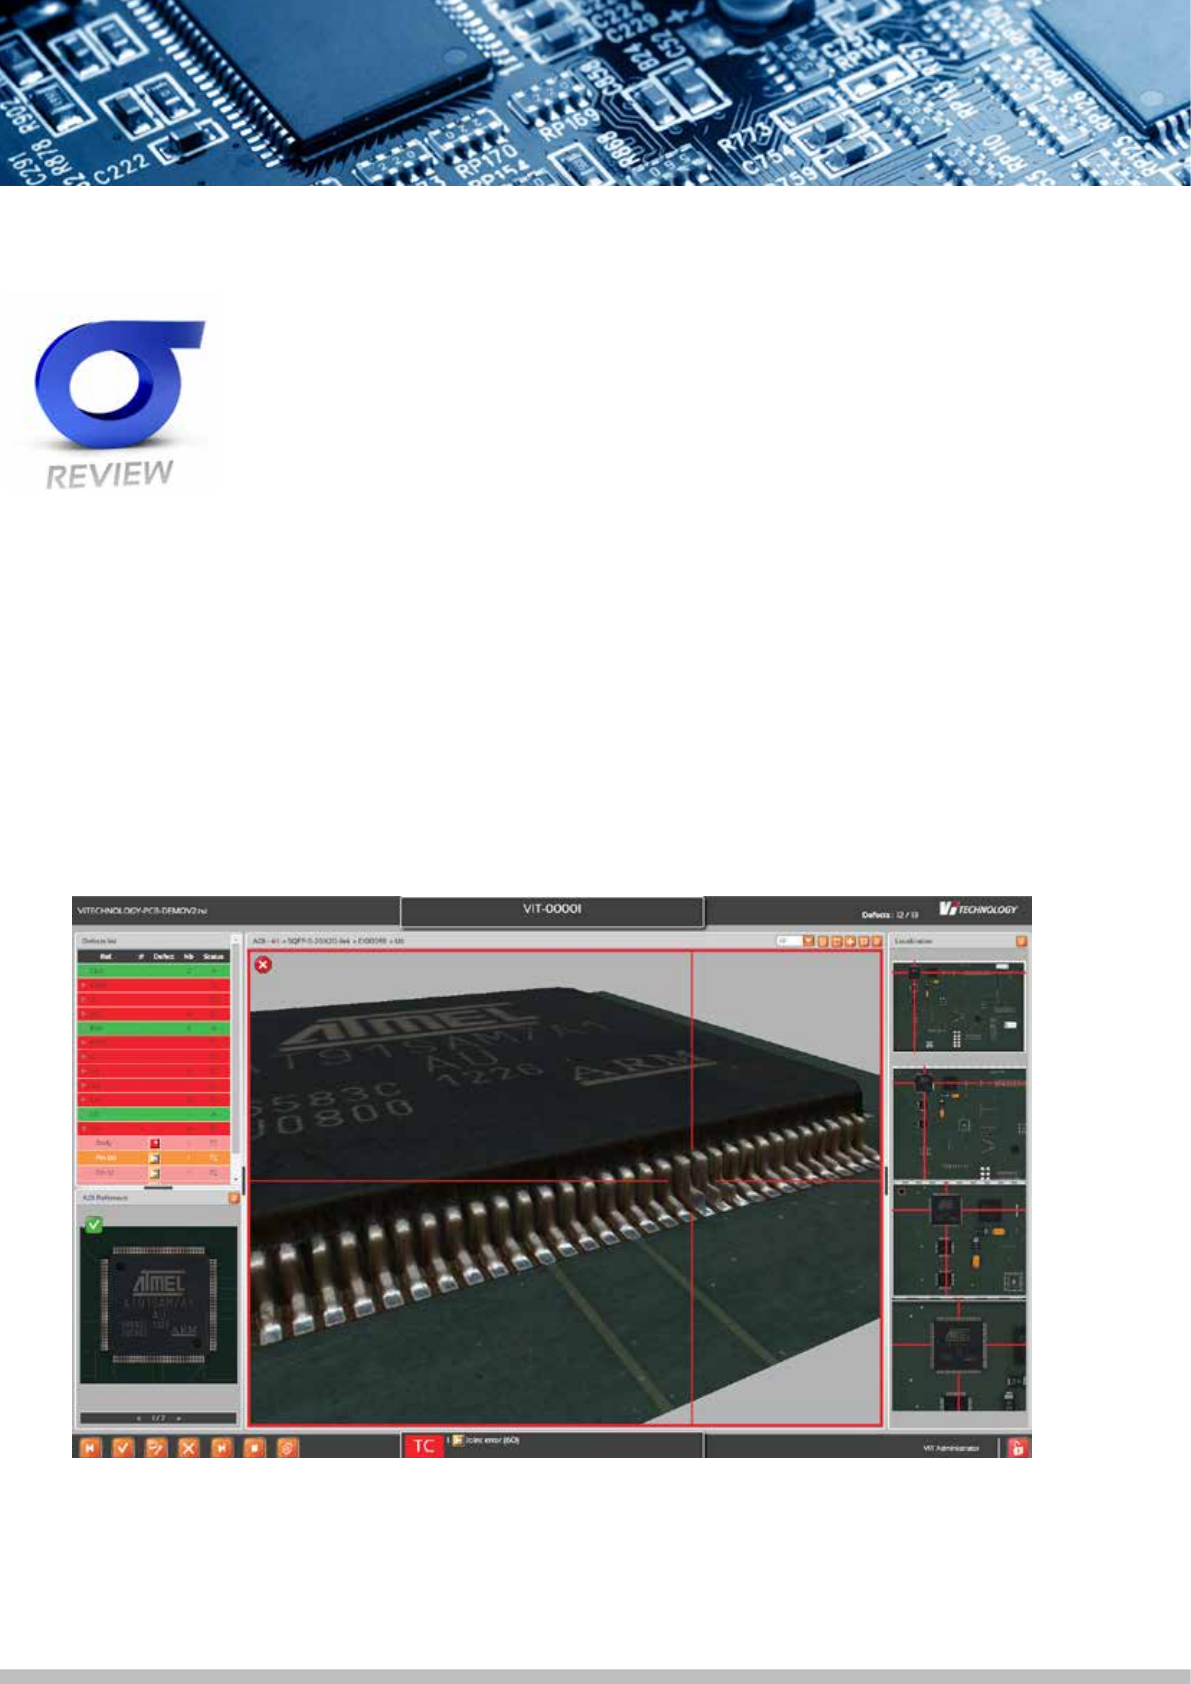
Review your process
in 3D
Review high quality 3D defect images to focus on what matters
• Localize defects at a glance
• Classify easily using reference image
• Use IPC or user-dened defect categories
• Benet from pre-dened corrective action messages
• Optimize review environment using customized screen layout
“Lifted lead is easily identied”