MR8740T_user_manual_eng_20191016H.pdf - 第13页
8 Setting Measurement Conditions T o set the sampling rate automatically Refer to “3.7 Measuring Signals With the Auto-range Setting” of Quick Start Manual. Update rate of each module The data refresh rate is not allowed…
7
Setting Measurement Conditions
7
Click the [Realtime save] button to set it to [On].
The instrument can record data in the built-in SSD and a storage device while measuring waveforms.
Refer to “Real-time save” (p. 88).
8
Congure the overlaying setting.
Refer to “3.1 Overlaying New Waveforms With Previously Acquired Waveforms” (p. 36).
9
Conguring the memory division settings
Refer to “Memory Dividing Function” (p. 173).
Sampling rate setting guideline
Choose a sampling rate using the following table as a guideline.
Maximum display
frequency
Sampling rate
Maximum display
frequency
Sampling rate
800 kHz 20 MS/s 80 Hz 2 kS/s
400 kHz 10 MS/s 40 Hz 1 kS/s
200 kHz 5 MS/s 20 Hz 500 S/s
80 kHz 2 MS/s 8 Hz 200 S/s
40 kHz 1 MS/s 4 Hz 100 S/s
20 kHz 500 kS/s 2 Hz 50 S/s
8 kHz 200 kS/s 0.8 Hz 20 S/s
4 kHz 100 kS/s 0.4 Hz 10 S/s
2 kHz 50 kS/s 0.2 Hz 5 S/s
800 Hz 20 kS/s 0.08 Hz 2 S/s
400 Hz 10 kS/s 0.04 Hz 1 S/s
200 Hz 5 kS/s
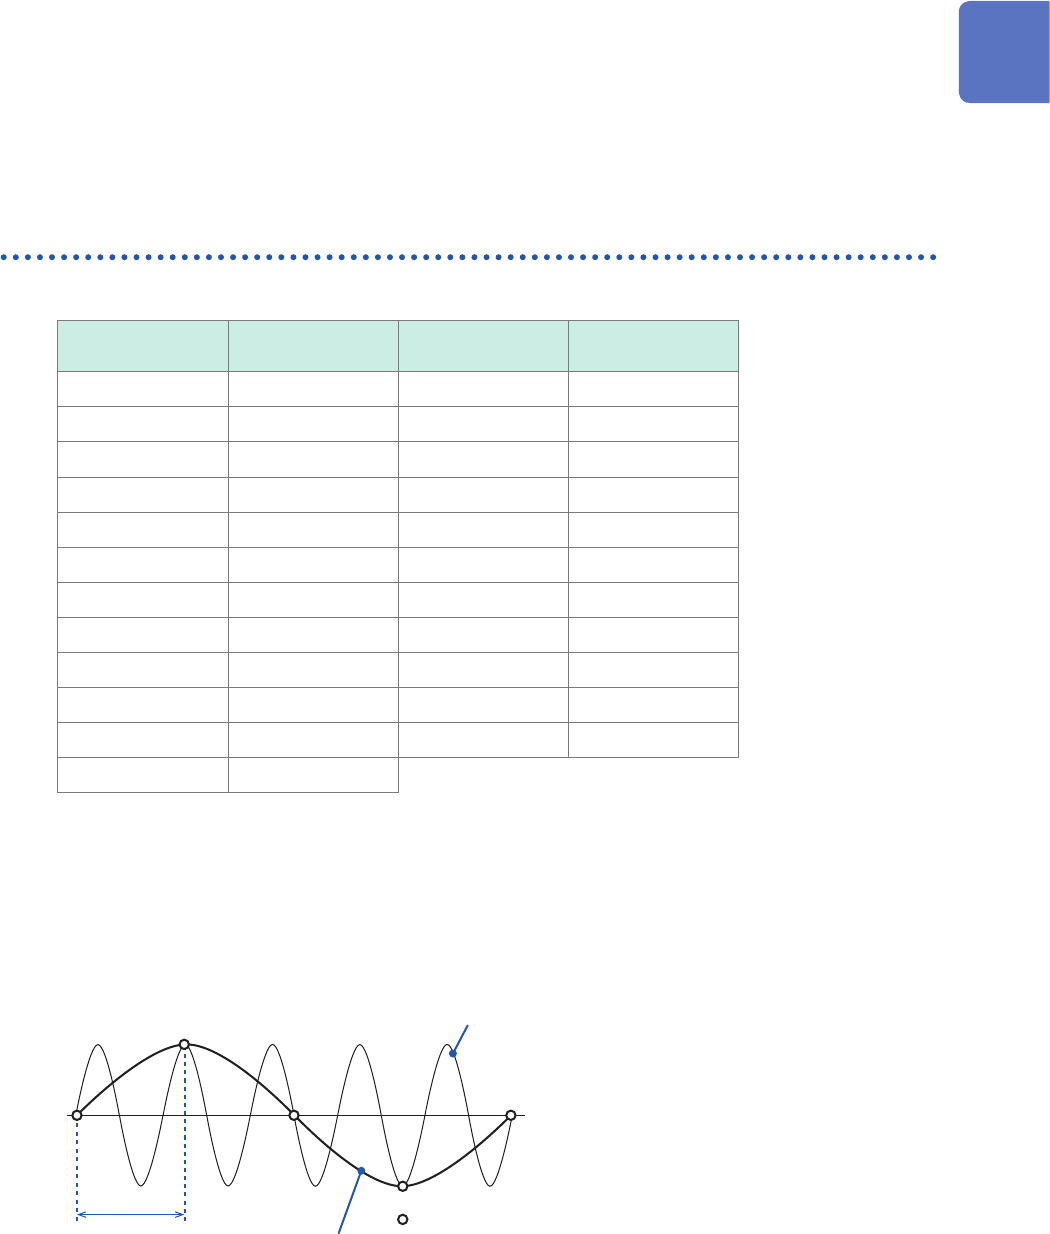
If the instrument plots false waveforms (aliasing)
If a measured signal oscillates at a higher frequency compared to the sampling rate you choose,
the instrument may plot a false waveform oscillating at a frequency lower than that of the actual
signal once the signal frequency reaches a certain level. This phenomenon is called aliasing.
Actual input
signal
Sampling interval:
Sampled points
Observed
waveform
A sampling interval longer than the cycle of the
input signal causes aliasing.
To plot a sign wave that allows you to observe the peaks without any aliasing, the instrument needs
to sample the waveform at a minimum of 25 points per cycle.
1
Measurement Method

8
Setting Measurement Conditions
To set the sampling rate automatically
Refer to “3.7 Measuring Signals With the Auto-range Setting” of Quick Start Manual.
Update rate of each module
The data refresh rate is not allowed to exceed the maximum sampling rate of each module.
The instrument measures the same data until the data gets updated, causing the instrument to plot
a stair-step waveform.
In addition, even though the instrument measures the same signal simultaneously, values may vary
due to differences in the sampling rate, frequency range, and frequency characteristics of modules.
Modules
Maximum sampling rate of module
or
data refresh rate
Reference
page
Model 8966 Analog Unit 20 MS/s (50 ns) –
Model 8967 Temp Unit Depends on the data refresh setting. p. 47
Model 8968 High Resolution Unit 1 MS/s (1 µs) –
Model U8969 Strain Unit 200 kS/s (5 µs) –
Model 8970 Freq Unit Depends on the setting. p. 51
Model 8971 Current Unit 1 MS/s (1 µs) –
Model 8972 DC/RMS Unit Depends on the response setting. p. 56
Model 8973 Logic Unit 20 MS/s (50 ns) –
Model MR8990
Digital Voltmeter Unit
Depends on the NPLC setting. p. 57
Model U8974 High Voltage Unit Depends on the response setting. p. 59
Model U8975 4ch Analog Unit 5 MS/s (200 ns) –
Model U8977 3CH Current Unit 5 MS/s (200 ns) –
Model U8978 4CH Analog Unit 5 MS/s (200 ns) –
Model U8979 Charge Unit 200 kS/s (5 µs) –
Model U8991 Digital Voltmeter Unit Depends on the NPLC setting. p. 65
9
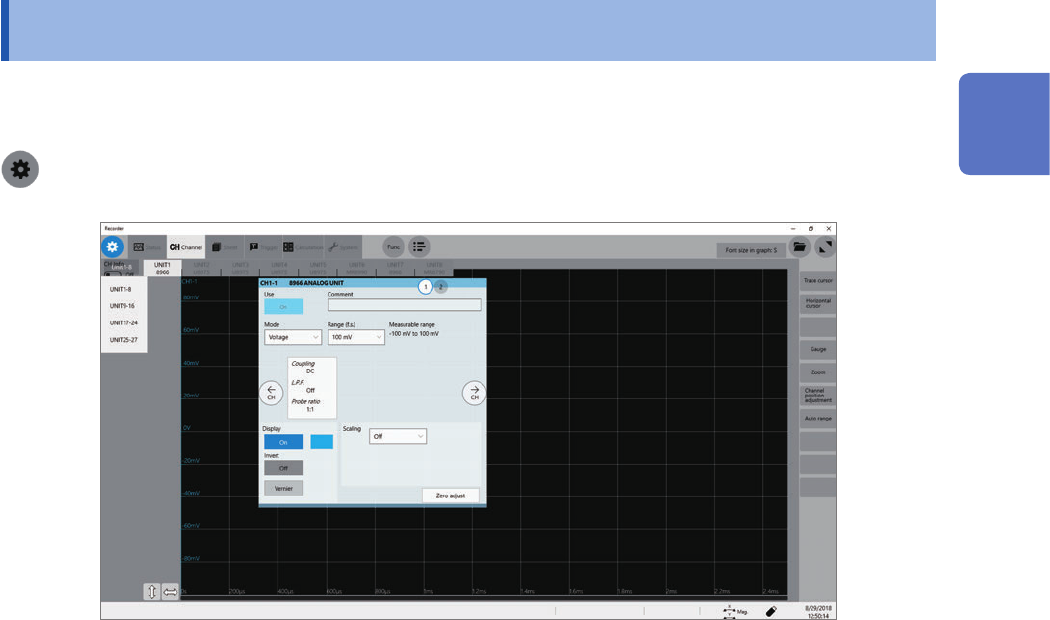
Conguring the Input Channel settings
1.3 Conguring the Input Channel settings
Congure the settings of the analog and logic channels.
> [Channel]
Operation available on the [Channel] screen
• Adding a comment to each channel
• Setting measurement conditions for each channel
• Conguring the display method setting for waveforms
• Converting measured values into physical quantities and displaying them
1
Measurement Method