MR8740T_user_manual_eng_20191016H.pdf - 第21页
16 Conguring the Sheet Settings 1.4 Conguring the Sheet Settings Y ou can dene the display format of waveforms on the sheet. Y ou can dene dif ferent display formats for each of the 16 sheets Y ou can also switch she…
15
Conguring the Input Channel settings
Logic channels
The logic sheet appears when the screen is in Single, Dual, Quad, Octa, or Hexadeca mode.
> [Channel]
1
2
1
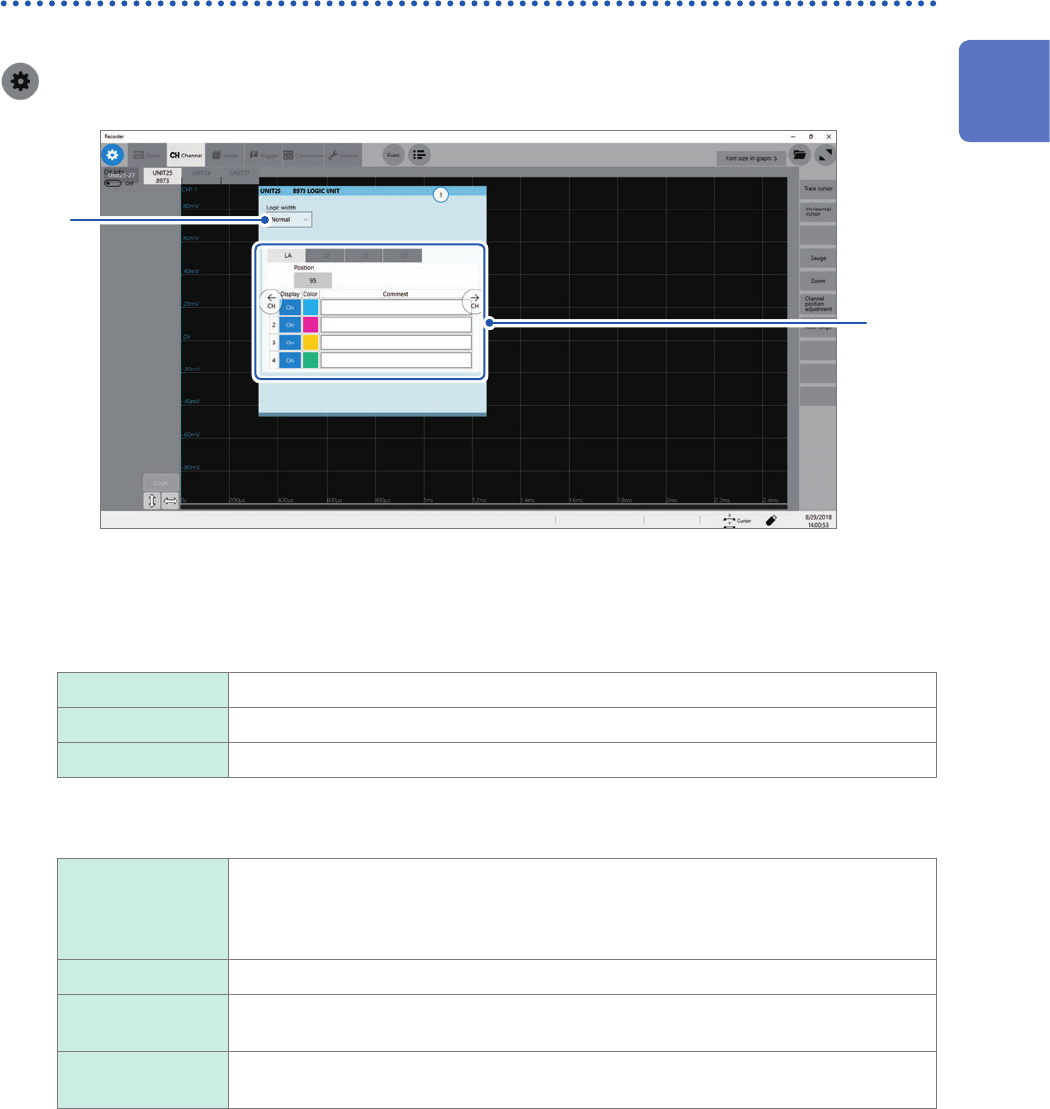
Click the [Logic width] box, and then choose a display width for logic waveforms from the
list.
Making waveforms narrower can enhance the readability of a display that contains a large number of
waveforms.
This setting is a cross-module for all logic modules installed in the instrument.
Wide Increases the width of the waveforms.
Normal
Displays the waveforms in normal width.
Narrow Reduces the width of the waveforms.
2
Choose a display method for each probe (LA through LD).
Position Allows you to specify a numeral that represents a logic waveform position on the
screen in one percent point increments.
This setting is cross-probe for all probes (LA through LD).
You can freely move display positions of the logic waveforms on the display.
Display Allows you to choose whether to display logic waveform.
Color Allows you to choose a waveform display color. You can also choose the same color
as lines acquired across other channels.
Comment Allows you to type a comment for each channel.
Number of characters that can be entered: up to 40
1
Measurement Method
16
Conguring the Sheet Settings
1.4 Conguring the Sheet Settings
You can dene the display format of waveforms on the sheet. You can dene different display
formats for each of the 16 sheets You can also switch sheets to be displayed on the waveform
screen.
> [Sheet]
1
4
2
3
1
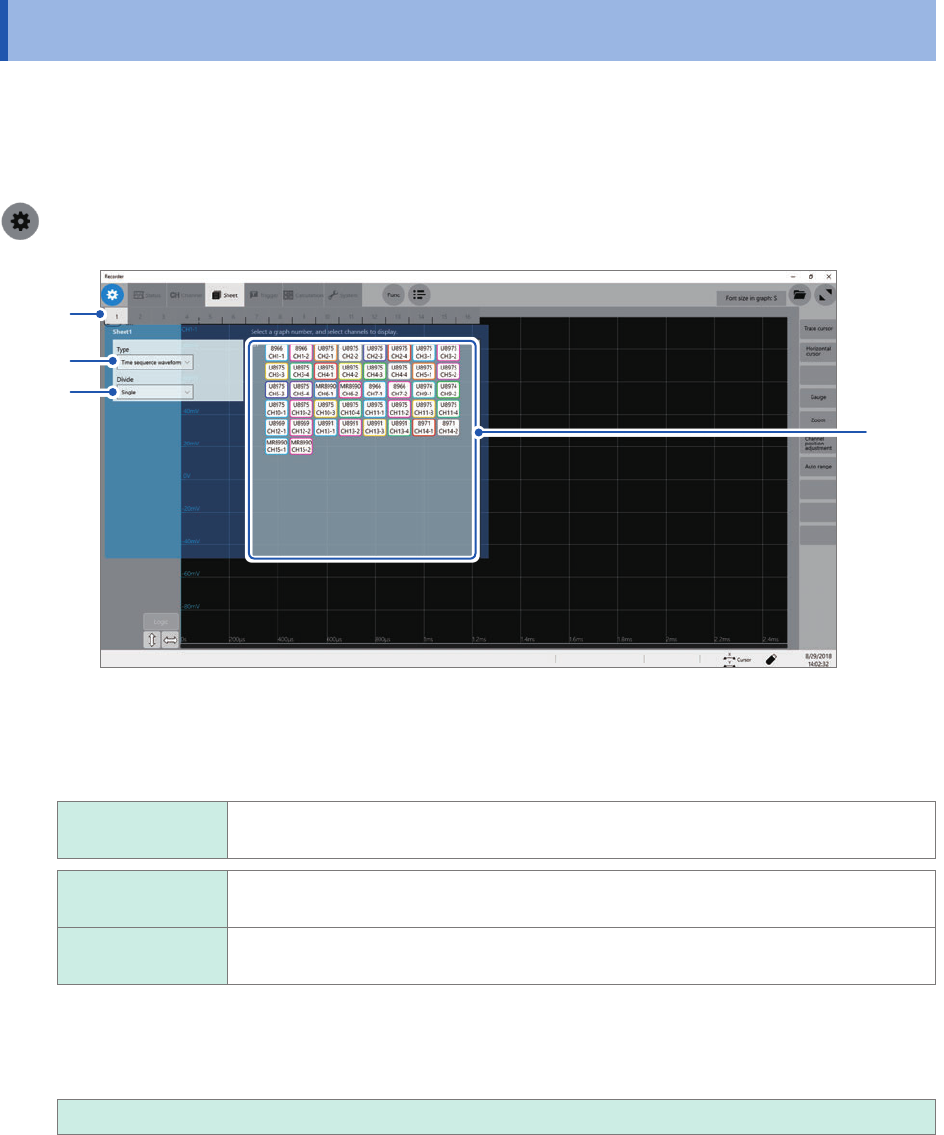
Choose a sheet.
2
Click the [Type] box, and then choose a display format from the list.
Time series
waveform
Displays time-domain waveforms.
Time series
waveform
Displays time-domain waveforms.
XY composite
waveform
Displays XY composite waveforms.
3
Click the [Divide] box, and then choose an option for the number of screens to be divided
from the list.
You can split the screen into multiple screens (graphs).
Single
, Dual, Quad, Octa, Hexadeca
4
Assign channels to the graph.
Click the display panel of each graph to open the [Select the channel] dialog box.
17
Conguring the Sheet Settings
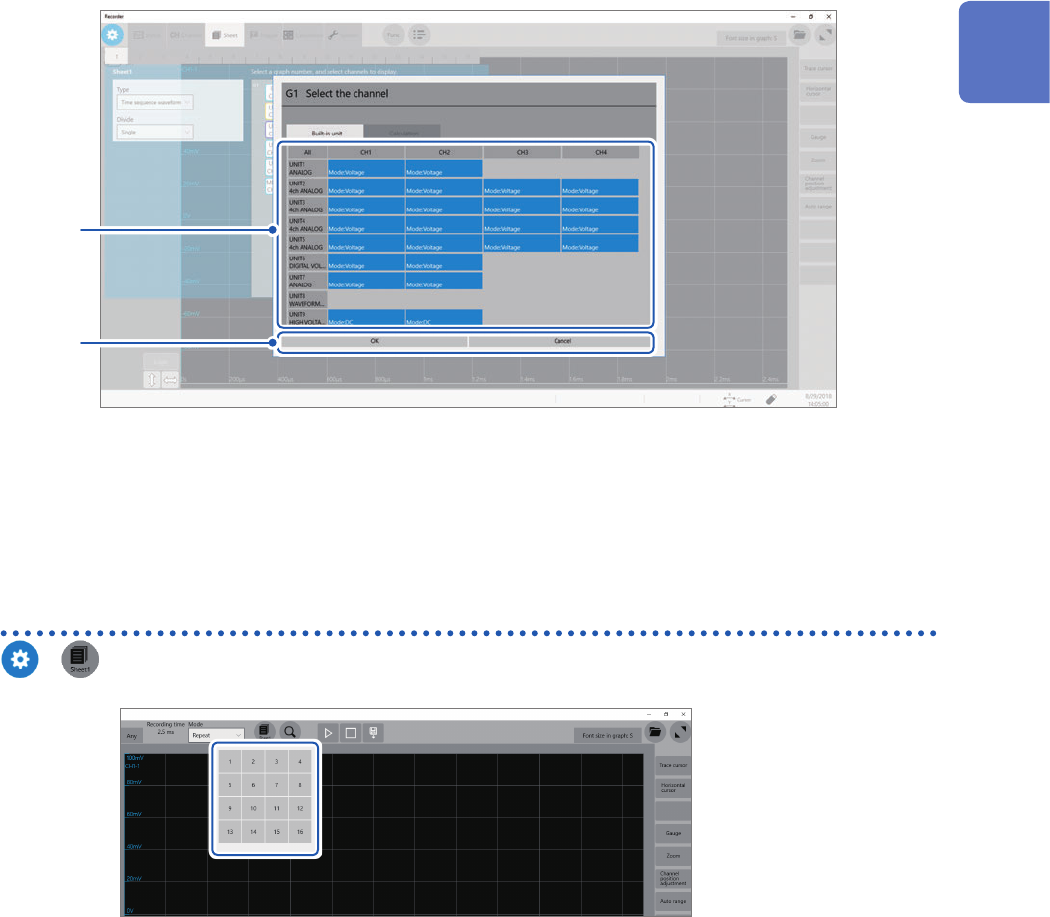
5
Choose channels to be displayed on the graph.
All channels are chosen in the default setting. Click a button to deselect a channel (Click it again to select it).
5
6
6
Click [OK].
Your selection is conrmed.
Clicking [Cancel] closes the dialog box without your selection conrmed.
Switching sheets on the waveform screen
>
Choose sheet numbers to be displayed.
1
Measurement Method