00191413-01.pdf - 第354页
11 Production Tools / Optimization User Manual Line Computer UNIX 11.4 Optimization Dial og Software Version 501.xx 01/99 Issue 11 - 34 Fig. 11.4.3 „Optimization results for xx.lose“ window for a lot file In the „O ptimi…

User Manual Line Computer UNIX 11 Production Tools / Optimization
Software Version 501.xx 01/99 Issue 11.4 Optimization Dialog
11 - 33
11.4.4 Command Area „Actions“
In the "Actions" command area, the icons are displayed by means of which the optimization of a lot file can be
started and aborted, as well as the results of the optimization run displayed.
- Start Optimization
Clicking on this icon causes the optimization process to be started.
● Click on .
● Click on the lot file you wish to be optimized.
The optimization process is started. The progress of the optimization process can be monitored in the
info box. The status of the lot file is described as „In progr.“.
After optimization has been successfully completed, the state of the lot file is identified as
„Optimized“.
- Stop Optimization
Clicking on this icon allows the current optimization process to be aborted.
● Click on
● Click on the lot file that is being optimized.
The optimization run in progress is aborted. The status of the lot file now changes to „Aborted“.
If optimization of this lot file was aborted, it may be restarted at any time.
- Display Results
This icon enables the results of the set-up optimization process to be displayed graphically both for
the entire lot file or for the individual jobs of a lot file. Moreover, the results of the producibility check
can be displayed for the individual jobs.
Displaying Optimization Results
● for the entire lot file:
● Click on .
● Click on the lot file containing the results are to be displayed.
The results of optimization are displayed in the „Optimization results for xx.lose“ window
(see Fig. 11.4.3).
● To obtain a printout: On the FILE menu click on the Print option.
The file will be printed on the printer connected.
11 Production Tools / Optimization User Manual Line Computer UNIX
11.4 Optimization Dialog Software Version 501.xx 01/99 Issue
11 - 34
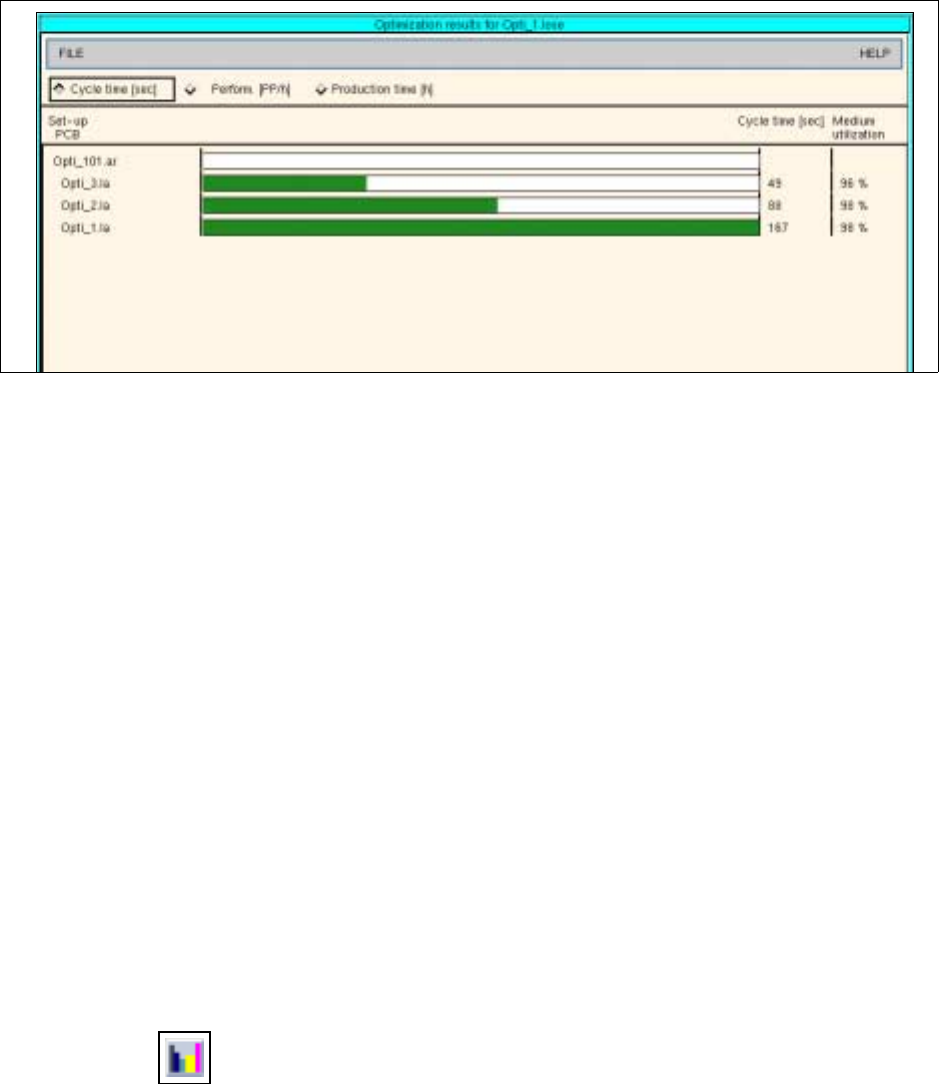
Fig. 11.4.3 „Optimization results for xx.lose“ window for a lot file
In the „Optimization results for xx.lose“ window, the following results can be called up:
- Cycle time [sec]: activation of this button causes the cycle time expected by Optimization, i.e. the
placement time (in seconds), to be displayed for all PCBs of the lot file.
- Perform. [PP/h]: activation of this button causes the performance of the line (in components per hour)
expected by Optimization to be displayed for all PCBs of the lot file.
- Production time [h]: activation of this button causes the production time (in hours) expected by Opti-
mization to be displayed for all PCBs of the lot file. The yellow bars represent the length of time
required for the changeover to a different setup.
● for individual jobs:
Note: As soon as a producibility check has been carried out for a lot file or job, not the optimization
results but rather the results of the producibility check will be displayed here. This can be recognized
by the window title bar and the colors of the result chart: the results of the optimization run are dis-
played in blue and pink, the results of the producibility check in green and red.
● Click on .
● Click on the lot file containing the job whose results are to be displayed.
The results of Optimization are displayed in the „Optimization results for xx.lose“ window (see Fig.
11.4.3).
● In the graph click on the green bar of the job.
The results of Optimization are displayed in the „Optimization results for xx.la“ window (see Fig.
11.4.4).
● To obtain a printout: On the FILE menu click on the Print option.
The file will be printed on the printer connected.
User Manual Line Computer UNIX 11 Production Tools / Optimization
Software Version 501.xx 01/99 Issue 11.4 Optimization Dialog
11 - 35
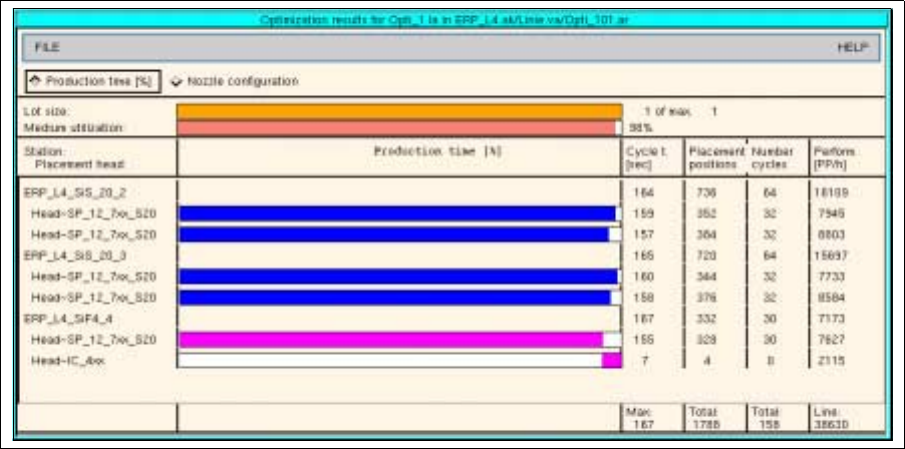
Fig. 11.4.4 „Optimization results xx.la" for a job
In the „Optimization results for xx.la“ window, the following results can be called up:
General results
- Lot size: indicates the relation of the lot size of the selected PCB to the maximum lot size within the
lot file.
- Medium utilization: indicates the mean value of the placement times per head in relation to the
placement time of the slowest placement head.
Utilization Chart
For each station, each placement head and the entire line, the results of the optimization process are
displayed in the following columns. The green and blue bars represent the production times of the individual
heads, and the red and pink bars indicate which placement head determines the cycle time in each case.
- Production time [%]: represents the production time for each placement head in the form of a bar.
The red bar indicates the placement heads with the longest production time.
- Cycle t. [sec]: indicates the cycle time for each placement head and the total cycle time for each sta-
tion in seconds. The total cycle time of the line additionally comprises all waiting and transport times.
- Placement positions: indicates the number of placement positions per placement head and the total
number of placement positions for each station and for the entire line.