4_Application_News_No_C153 - 第4页
Application News No. C153 First Edition: Aug. 2 017 For Research Use Only. N ot for use i n diagnostic p rocedure. This publication may contain references to products that are not available in your country. Please contac…
Application
News
No.
C153
Validation Test of the Fully Automated
Pretreatment Analysis Method
Calibration curves were created from the control blood
plasma with standards added and the integrity of
accuracy and precision were evaluated based on the
analysis results of the QC samples (at concentrations of
n = 5) (Table 2). Good linearity was obtained in the set
concentration range for all antiarrhythmics. The
accuracy of the QC samples in the entire range,
including the quantitative lower limit, was within 100
± 15 %. Similarly, precision (%RSD) was within 15 % and
good repeatability was obtained.
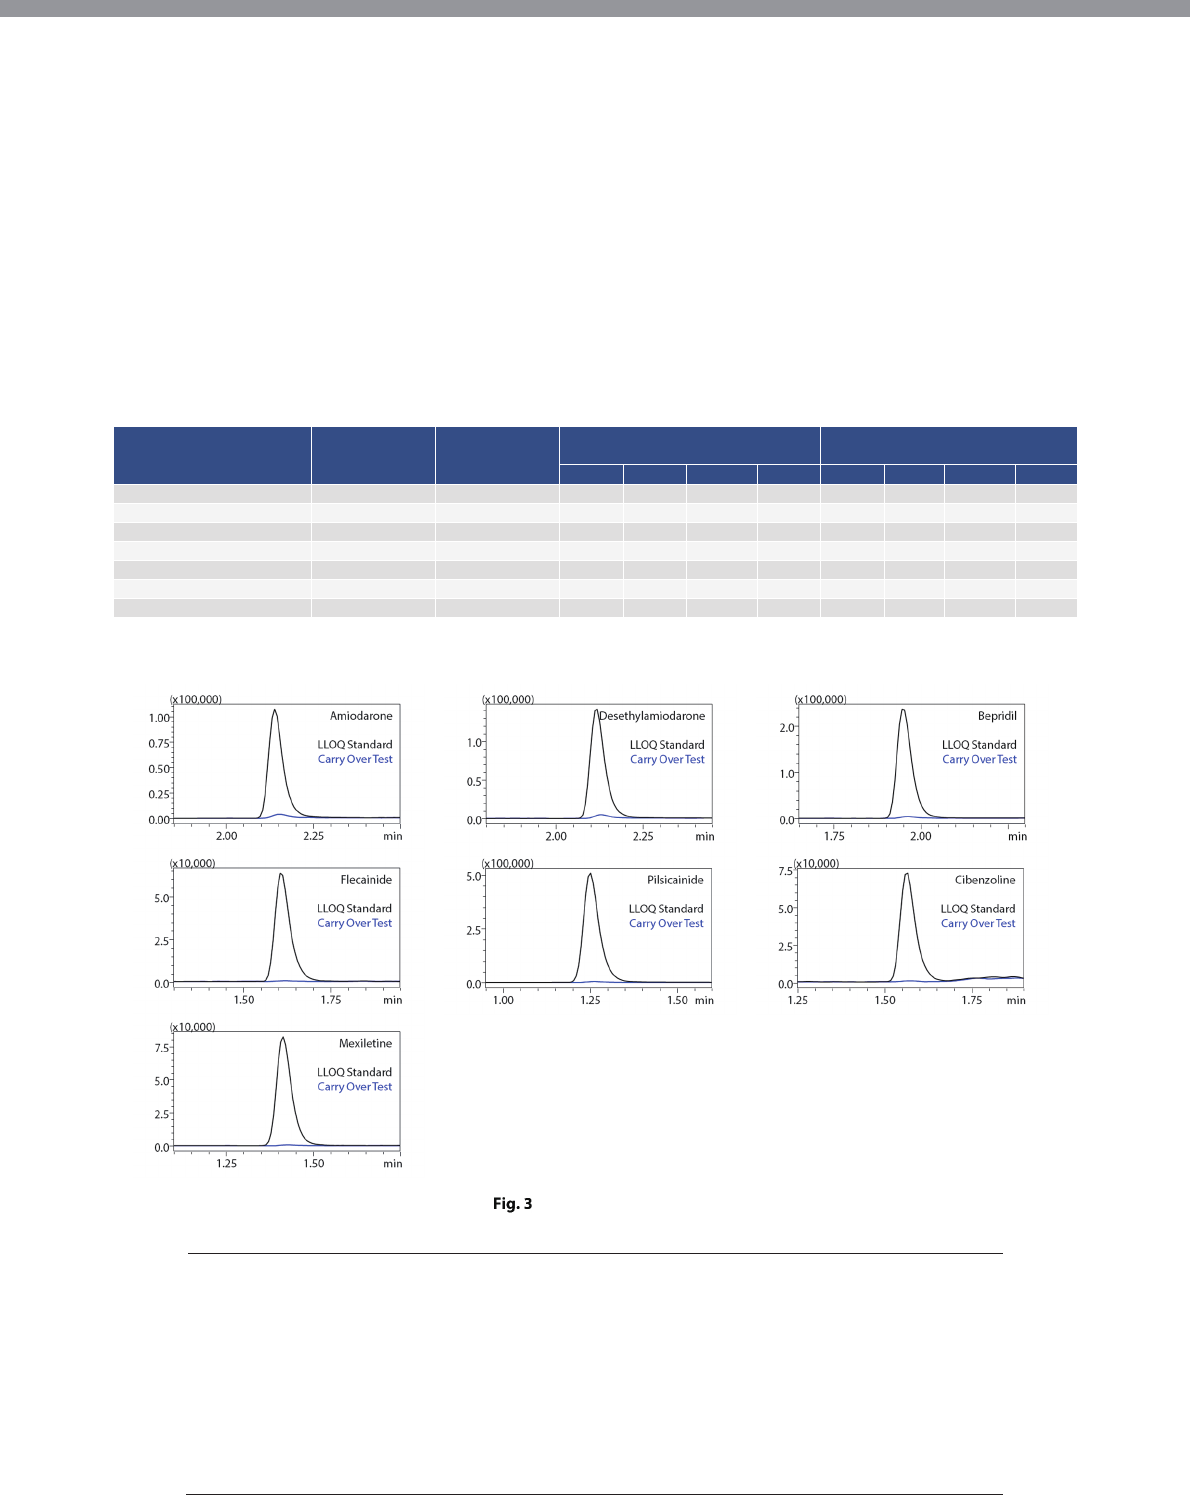
Immediately after analysis of the highest calibration
standard sample, blank blood plasma was measured to
check for carryover in the fully automated sample
preparation LC/MS/MS system. No significant carryover
was detected for any of the drugs upon comparison
with the peak intensity of the lowest calibration
standard sample (Fig. 3).
The above results show that the fully automated
sample preparation LC/MS/MS system used in this
article is capable of sufficiently reliable quantitative
analysis when performing consecutive analyses of
samples of wide-ranging concentrations.
Table 2 Validation Test Results for Simultaneous Analysis of Antiarrhythmic Drugs and Metabolites
Compounds
Cal. Range
[ng/mL]
Correlation
Coefficient
R
Accuracy
%
Precision
%RSD, n=5
LLOQ Low Medium High LLOQ Low Medium High
Amiodarone
*1
100-3000 0.9983 98.3 100.6 99.4 103.9 4.1 2.9 3.0 2.7
Desethylamiodarone
*1
100-3000 0.9987 99.2 98.9 101.1 100.3 5.3 4.2 3.6 4.2
Bepridil
*2
50-1500 0.9992 100.9 100.5 96.6 103.4 4.1 3.7 2.3 1.8
Flecainide
*2
50-1500 0.9987 98.1 98.7 96.7 101.4 4.7 3.3 2.4 2.4
Pilsicainide
*1
100-3000 0.9987 100.4 99.6 97.3 104.8 4.0 3.0 1.8 2.0
Cibenzoline
*2
50-1500 0.9987 102.4 101.4 99.1 102.9 4.2 3.4 3.0 2.4
Mexiletine
*1
100-3000 0.9984 104.5 107.4 106.3 107.8 3.8 3.9 2.6 2.6
*1: 100 ng/mL for LLOQ, 250 ng/mL for Low, 1000 ng/mL for Medium, 3000 ng/mL for High
*2: 50 ng/mL for LLOQ, 125 ng/mL for Low, 500 ng/mL for Medium, 1500 ng/mL for High
Carryover Test Results
Table 3 Analysis Conditions (Validation Test)
S
y
stem : CLAM-2000 + Nexera + LCMS-8060
Protocol : Plasma disp. 15 μL - acetonitrile disp. 285 μL - shaking at 1900 rpm, 120 sec - filtration for 90 sec
Column : Shimadzu GLC Mastro C18 (50 mmL. × 2.1 mmI.D., 3 μm)
Mobile Phase : A) 0.1% Formic acid - Water, B) 0.1% Formic acid - Methanol
Flow Rate : 0.4 mL/min
Time pro
g
ram : B Conc. 10% (0 min) – 100% (2 – 3.5 min) – 10% (3.51 – 6 min)
Column Temp. 50 °C In
j
ection Volume : 0.2 μL
Probe Volta
g
e : 2.0 kV (ESI-positive mode)
Interface Temp. : 300 °C DL Temp. : 250 °C
Block Heater Temp. : 400 °C Nebulizing Gas Flow : 3 L/min
Heatin
g
Gas Flow : 10 L/min Dr
y
in
g
Gas Flow : 10 L/min
Carry Over Test:
Analysis of Blank Plasma Following
The Highest Calibration Standard Sample
Application
News
No.
C153
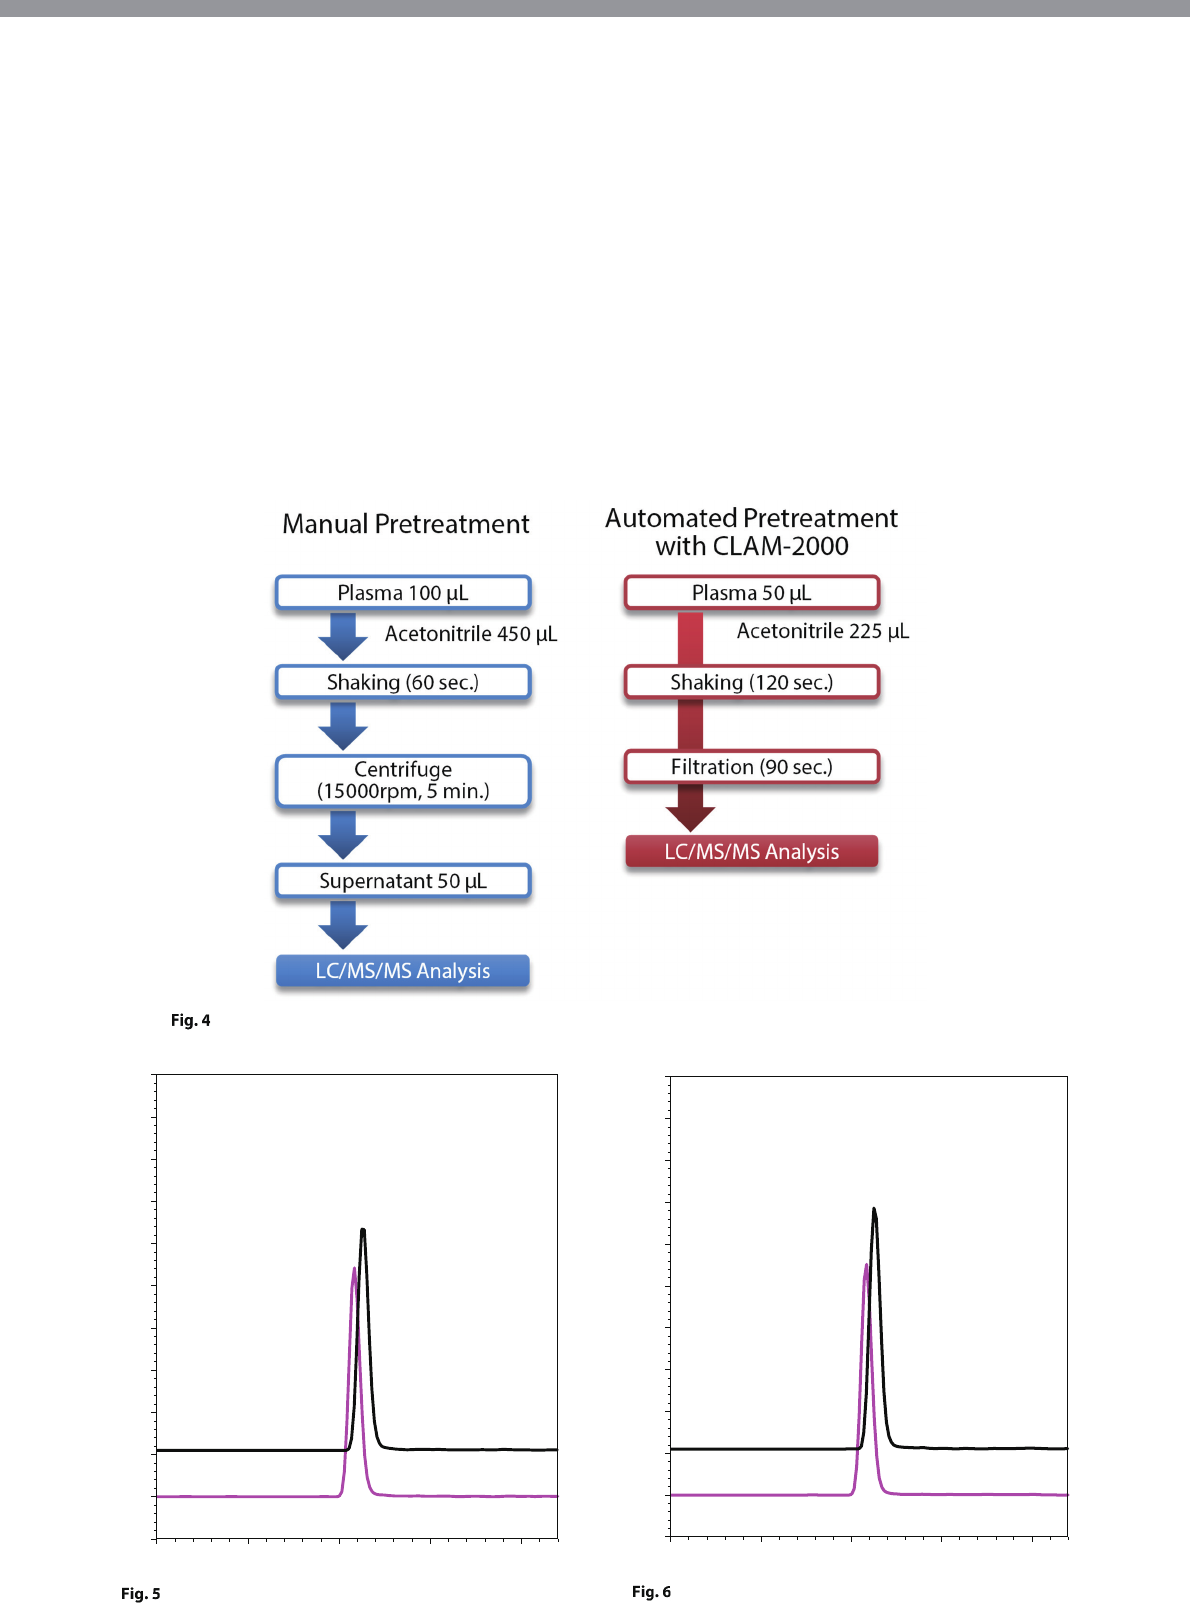
Comparative Test with Manual Pretreatment
A comparative test was performed between a manual
pretreatment method and the fully automated
pretreatment analysis method that employs the fully
automated sample preparation LC/MS/MS system.
Human blood plasma for measuring the concentration
of amiodarone was used.
The manual pretreatment method involved manually
isolating the blood plasma, adding acetonitrile, and
mixing to perform deproteinization. After centrifugal
separation of this sample, the supernatant was then
transferred to a vial for LC/MS/MS analysis. On the
other hand, the fully automated pretreatment analysis
method enabled the entire analysis process, from
blood plasma isolation to LC/MS/MS analysis, to be
performed completely automatically using the system
described in this article (Fig. 4).
A comparison of quantitative values between the
methods was performed for amiodarone and the
metabolite desethylamiodarone (Fig. 5 and 6, Table 4
and 5). In the wide range of concentrations detected
from the samples, there was favorable agreement
between the quantitative results of the manual
pretreatment method and the fully automated
pretreatment analysis method. The coefficient of
determination (R2) of both methods calculated from
these results was 0.95 or higher (Fig. 7 and 8).
The fully automated pretreatment analysis method
used by this system is a fast and low-burden analysis
technique that achieves quantitative results equivalent
to conventional manual pretreatment methods and we
anticipate its utilization into the future.
Pretreatment Workflow of the Manual Pretreatment Method and Fully Automated Pretreatment Analysis Method
Human Blood Plasma (Sample 3) Analysis Results Using
the Manual Pretreatment Method
Human Blood Plasma (Sample 3) Analysis Results Using
the Fully Automated Pretreatment Analysis Method
1.50 1.75 2.00 2.25 min
-0.1
0.0
0.1
0.2
0.3
0.4
0.5
0.6
0.7
0.8
0.9
1.0
(x100,000)
2:DEA 618.00>72.10(+) CE: -32.0
1:AMD 646.00>58.10(+) CE: -52.0
Manual
Pretreatment
Amiodarone
546 ng/mL
Desethylamiodarone
416 ng/mL
1.50 1.75 2.00 2.25 min
-0.1
0.0
0.1
0.2
0.3
0.4
0.5
0.6
0.7
0.8
0.9
1.0
(x100,000)
2:DEA 618.00>72.10(+) CE: -32.0
1:AMD 646.00>58.10(+) CE: -52.0
Automated Pretreatment
with CLAM-2000
Amiodarone
557 ng/mL
Desethylamiodarone
423 ng/mL

Application
News
No.
C153
First Edition: Aug. 2017
For Research Use Only. Not for use in diagnostic procedure.
This publication may contain references to products that are not available in your country. Please contact us to check the availability of these
products in your country.
The content of this publication shall not be reproduced, altered or sold for any commercial purpose without the written approval of Shimadzu.
Company names, product/service names and logos used in this publication are trademarks and trade names of Shimadzu Corporation or its
affiliates, whether or not they are used with trademark symbol “TM” or “£”. Third-party trademarks and trade names may be used in this
publication to refer to either the entities or their products/services. Shimadzu disclaims any proprietary interest in trademarks and trade names
other than its own.
The information contained herein is provided to you "as is" without warranty of any kind including without limitation warranties as to its
accuracy or completeness. Shimadzu does not assume any responsibility or liability for any damage, whether direct or indirect, relating to the
use of this publication. This publication is based upon the information available to Shimadzu on or before the date of publication, and subject
to change without notice.
© Shimadzu Corporation, 2017
www.shimadzu.com/an/
Table 4 Quantitative Results of the
Manual Pretreatment Method and
Fully Automated Pretreatment Analysis Method
(Amiodarone)
Amiodarone
Manual
[ng/mL]
Automated
[ng/mL]
Ratio %*
Sample 1 373 411 110.2
Sample 2 399 404 101.3
Sample 3 546 557 102.0
Sample 4 205 211 102.9
Sample 5 963 895 92.9
Sample 6 1,318 1,213 92.0
Sample 7 1,271 1,229 96.7
Sample 8 1,233 1,282 104.0
Sample 9 2,259 2,208 97.7
Avera
g
e 100.0
RSD % 5.8
* Automated Pretreatment / Manual Pretreatment
Comparison of Quantitative Results for Amiodarone
Table 5 Quantitative Results of the
Manual Pretreatment Method and
Fully Automated Pretreatment Analysis Method
(Desethylamiodarone)
Desethylamiodarone
Manual
[ng/mL]
Automated
[ng/mL]
Ratio %*
Sample 1 304 271 89.1
Sample 2 412 366 88.8
Sample 3 416 423 101.7
Sample 4 271 240 88.6
Sample 5 717 654 91.2
Sample 6 151 150 99.3
Sample 7 431 408 94.7
Sample 8 664 628 94.6
Sample 9 940 1,080 114.9
Avera
g
e 95.9
RSD % 8.9
* Automated Pretreatment / Manual Pretreatment
Comparison of Quantitative Results
for Desethylamiodarone
Table 6 Analysis Conditions (Comparative Test of Pretreatment Methods)
S
y
stem : CLAM-2000 + Nexera + LCMS-8040
Protocol : Plasma disp. 50 μL - acetonitrile disp. 225 μL - mixing at 1900 rpm, 120 sec - filtration for 90 sec
Column : Shimadzu GLC Mastro C18 (50 mmL. × 2.1 mmI.D., 3 μm)
Mobile Phase : A) 0.1% Formic acid - Water, B) 0.1% Formic acid - Methanol
Flow Rate : 0.4 mL/min
Time pro
g
ram : B Conc. 10 % (0 min) – 100 % (2 – 3.5 min) – 10 % (3.51 – 6 min)
Column Temp. 50 °C In
j
ection Volume : 0.1 μL
Probe Volta
g
e : 4.5 kV (ESI-positive mode)
DL Temp. : 250 °C Block Heater Temp. : 400 °C
Neb. Gas Flow : 3 L/min Dr
y
ing Gas Flow : 15 L/min
[Acknowledgments]
We would like to thank pharmacist Yuko Shimamoto of the Pharmacy Division at the National Cerebral and Cardiovascular Center Hospital
(National Research and Development Agency) in Japan for her significant cooperation in the investigation provided in this article.
References • Guidance for Industry : Bioanalytical Method Validation (2001, US FDA)
• Guideline on Bioanalytical Method Validation in Pharmaceutical Development (2013, Japan MHLW)
Notes • The product described in this document has not been approved or certified as a medical device under the Pharmaceutical and
Medical Device Act of Japan. It cannot be used for the purpose of medical examination and treatment or related procedures.
• The samples described in this document were all sampled and measured at the National Cerebral and Cardiovascular Center
Hospital in Japan. Permission was obtained regarding the publication of measurement data.
y = 0.975x
R² = 0.9946
0
500
1000
1500
2000
2500
0 500 1000 1500 2000 2500
Automated Pretreatment
[ng/mL]
Manual Pretreatment
[ng/mL]
AMD
y = 1.007x
R² = 0.9541
0
250
500
750
1000
1250
0 250 500 750 1000 1250
Automated Pretreatment
[ng/mL]
Manual Pretreatment
[ng/mL]
DEA