IPC-TM-650 EN 2022 试验方法--.pdf - 第19页
T a ble 3: G ood Parts That We re Rejected Score a ‘‘1’ ’ w here good parts were rejected in T able 1 ab ove. Score a ‘‘0’ ’ e verywhere else. Note the scores for each tester in the tab le below . T ester Samples 1 2 3 4…
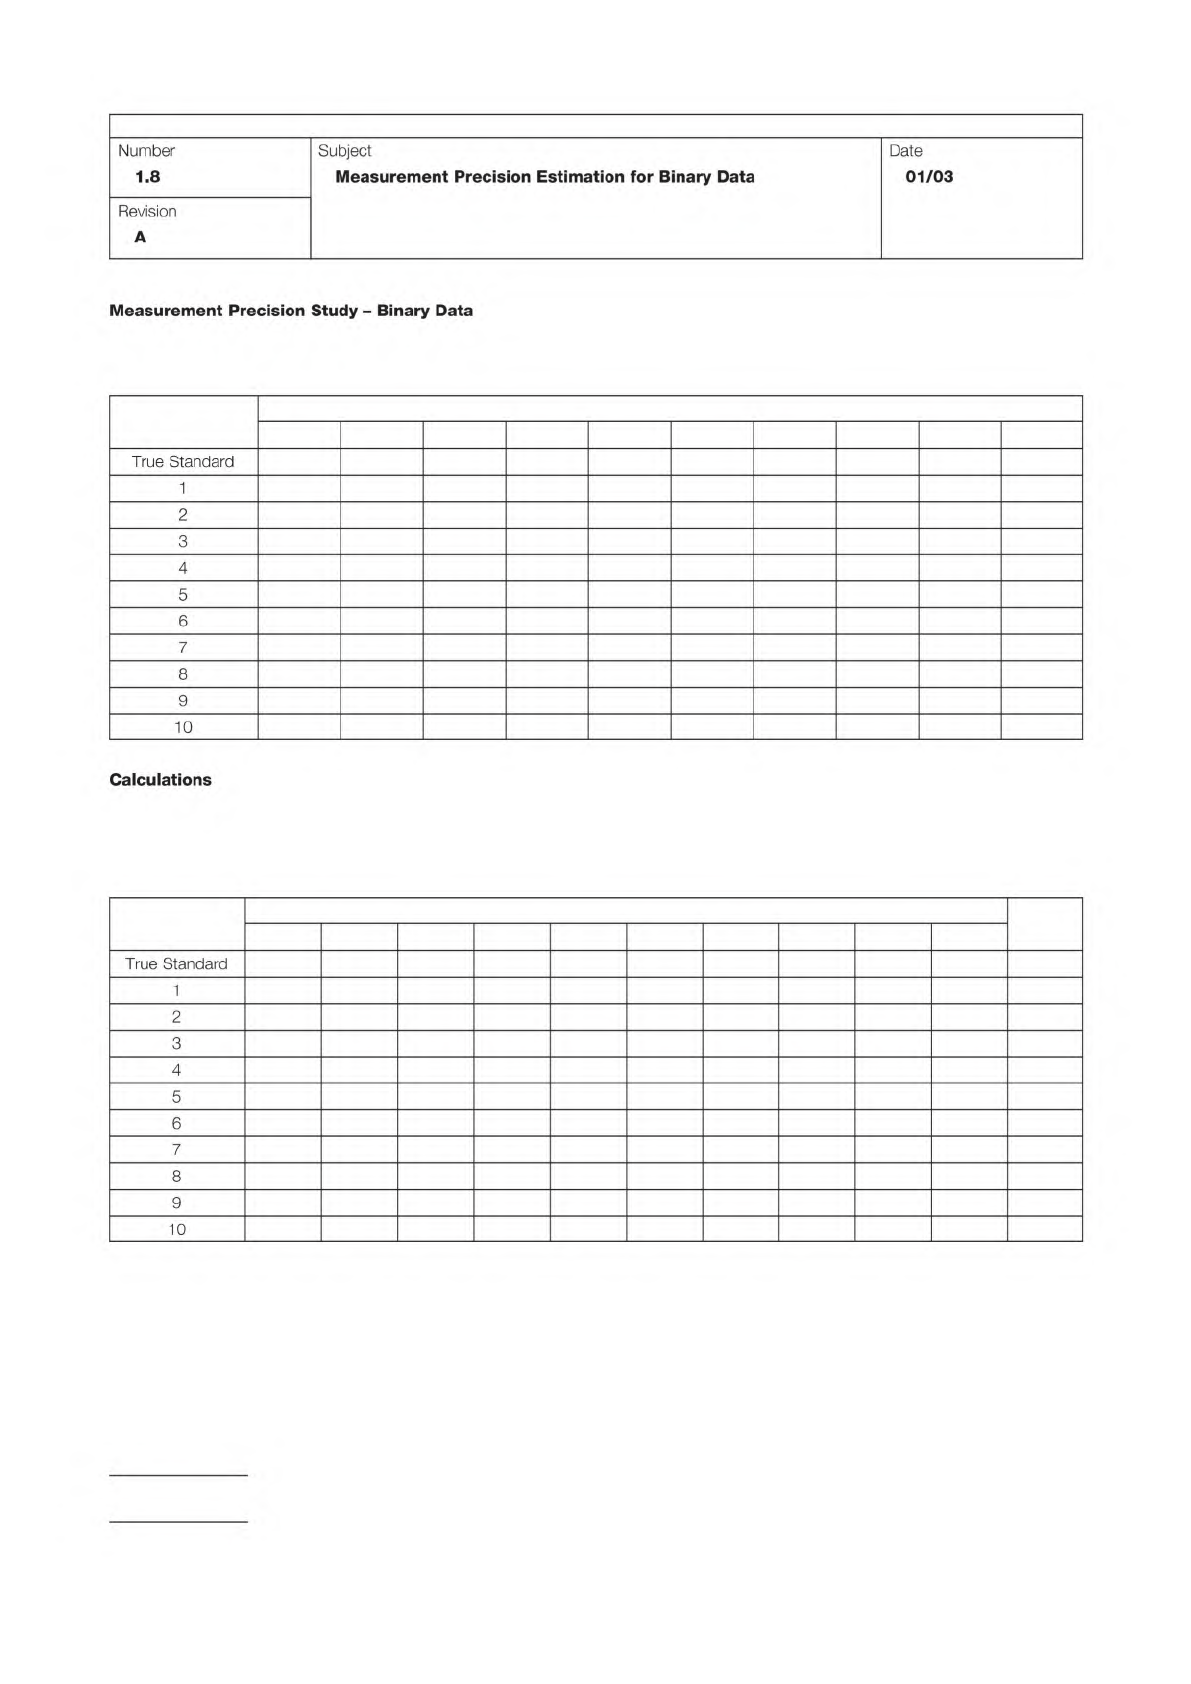
Table 1: Data Entry Form
Enter test results into the table below.
Tester
Samples
1 2 3 4 5 6 7 8 9 10
Table 2: Samples Dispositioned Correctly
Score a ‘‘1’’ where disposition in Table 1 above matched the true standard.
Score a ‘‘0’’ where disposition did not match the true standard.
Note these scores for each of the testers in the table below.
Tester
Samples
1 2 3 4 5 6 7 8 9 10 Total
IPC-TM-650
Page 4 of 6
Number
1.8
Subject
Measurement
Precision
Estimation
for
Binary
Data
Date
01/03
Revision
A
Measurement
Precision
Study
-
Binary
Data
True
Standard
1
2
3
4
5
6
7
8
9
10
Calculations
True
Standard
1
2
3
4
5
6
7
8
9
10
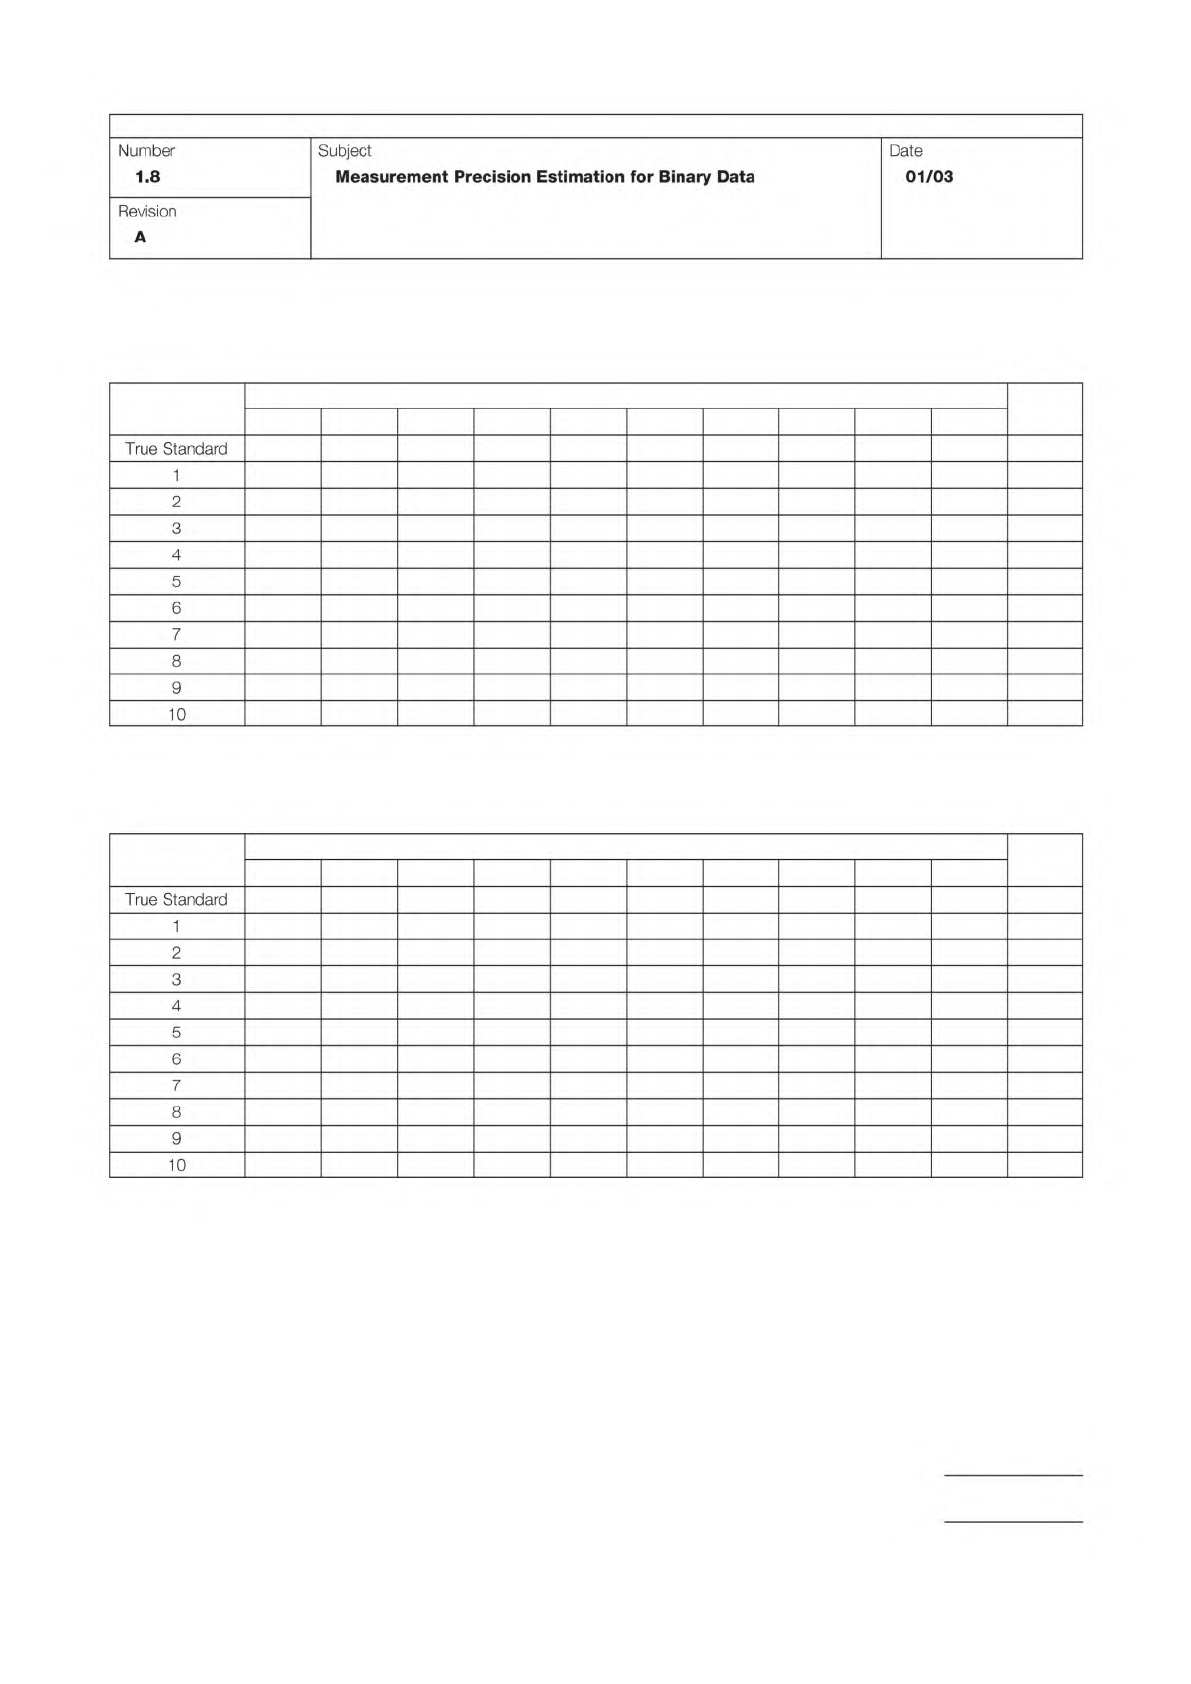
Table 3: Good Parts That Were Rejected
Score a ‘‘1’’ where good parts were rejected in Table 1 above.
Score a ‘‘0’’ everywhere else.
Note the scores for each tester in the table below.
Tester
Samples
1 2 3 4 5 6 7 8 9 10 Total
Table 4: Bad Parts That Were Accepted
Score a ‘‘1’’ where bad parts were accepted in Table 1 above.
Score a ‘‘0’’ everywhere else.
Tester
Samples
1 2 3 4 5 6 7 8 9 10 Total
IPC-TM-650
Page 5 of 6
Number
1.8
Subject
Measurement
Precision
Estimation
for
Binary
Data
Date
01/03
Revision
A
True
Standard
1
2
3
4
5
6
7
8
9
10
True
Standard
1
2
3
4
5
6
7
8
9
10
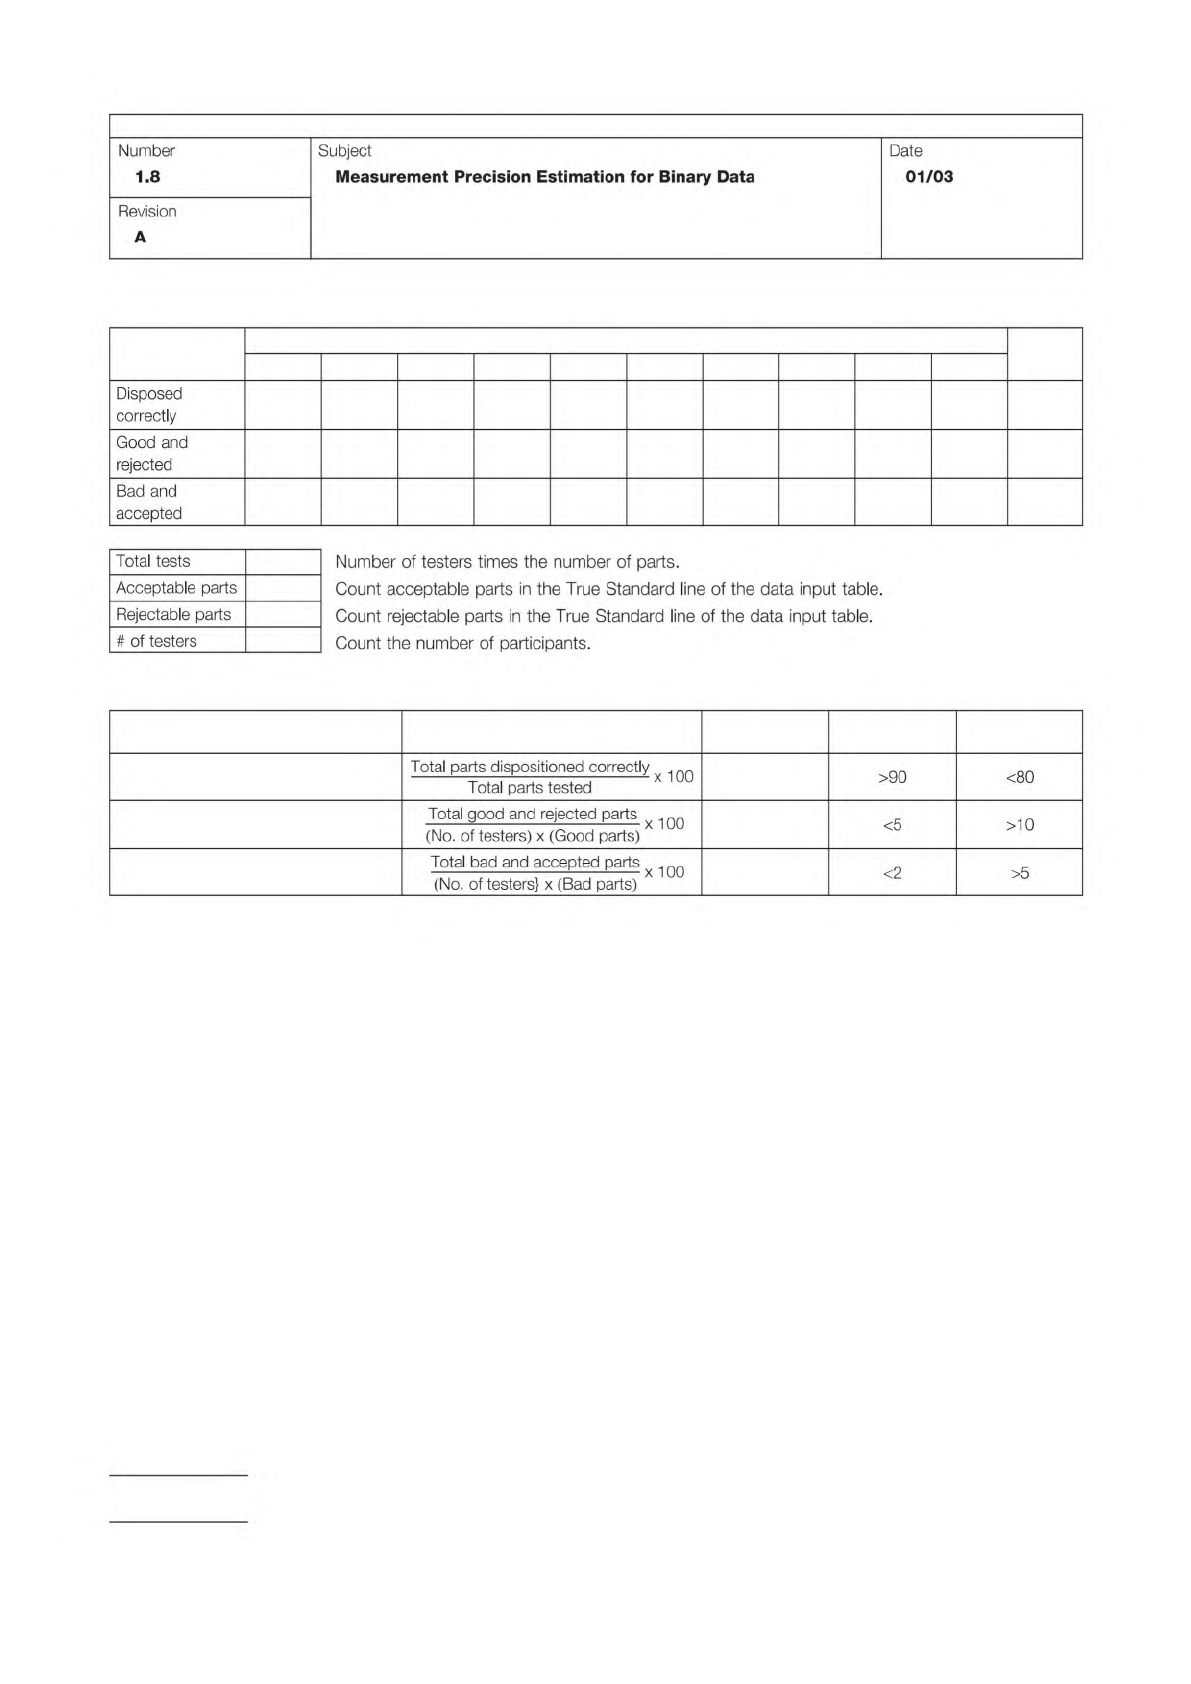
Table 5: Measurement System Scorecard
Results
Tester
1 2 3 4 5 6 7 8 9 10 Total
Table 6: Measurement System Effectiveness
Metric Calculation Result Acceptable
Needs
Improvement
Test effectiveness (%)
Probability of false rejects (%)
Probability of false acceptance (%)
IPC-TM-650
Page 6 of 6
Number
1.8
Subject
Measurement
Precision
Estimation
for
Binary
Data
Date
01/03
Revision
A
Disposed
correctly
Good
and
rejected
Bad
and
accepted
Total
tests
Number
of
testers
times
the
number
of
parts.
Acceptable
parts
Count
acceptable
parts
in
the
True
Standard
line
of
the
data
input
table.
Rejectable
parts
Count
rejectable
parts
in
the
True
Standard
line
of
the
data
input
table.
#
of
testers
Count
the
number
of
participants.
Total
parts
dispos
用
oond
correctly
x
也。
Total
parts
tested
>90
<80
Total
good
acd
rejected
parts
x
死。
(No.
of
testers)
x
(Good
parts)
<5
>10
Total
bad
and
accepted
parts
死。
(No.
of
testers}
x
(Bad
parts)
<2
>5