IPC-TM-650 EN 2022 试验方法--.pdf - 第282页
ASTM-D-689 Figure 1 The Institute for Int erconnecting and Packaging E lectronic Circuits 2215 S anders Road • Northbrook, IL 60062-6135 Material in this T est M ethods Manual was vol untaril y establis hed by T echni ca…

5 Conditioning
5.1 Conditioning
The test specimens be conditioned
at 23 °C ± 2 °C (73.4 °F ± 3.6 °F) and 50% ± 5% relative
humidity for not less than 24 hours prior to test.
5.2 Test Conditions
Conduct tests in the Standard Labo-
ratory Atmosphere of 23 °C ± 2 °C (73.4 °F ± 3.6 °F) and 50
± 10 percent relative humidity.
6 Speed of Testing
A jaw separation of 25.4 mm [1 in]
be used. The rate of travel of the power activated grip
be 51 mm [2 in]/minute and be uniform at all
times.
7 Procedure
7.1
Measure the thickness of the specimen at several points
to the accuracy limits of the measuring devices specified in
4.3. Record the average thickness in millimeters or microns
[in].
7.2
Place the specimen in the grips of the testing machine
so that the long axes of the enlarged ends of the specimen
are in line with the points of attachment of the grips to the
machine.
7.3
Apply the load at 51 mm [2 in]/minute rate of grip sepa-
ration. After complete rupture of the specimen, the maximum
tearing load in grams [ounces]
be noted from the dial
scale or recorder chart and recorded. Data from specimens
which break at some obvious flaw or which break in or at the
edges of the grips
be discarded and retests made.
8 Calculation
The average resistance to tearing be
calculated from five specimens tested in each principal direc-
tion of orientation. Data
be recorded as grams [ounces]
of tearing resistance.
9 Report
9.1
Report the average thickness of all specimens.
9.2
Report the average transverse and the average longitu-
dinal initiation tear strength values.
Number
2.4.16
Subject
Initiation Tear Strength, Flexible Insulating Materials
Date
03/14
Revision
B
P g
IPC-TM-650
shall
shall
shall
shall
shall
shall
shall
shall
a
e
2
of
2
ASTM-D-689
Figure 1
The Institute for Interconnecting and Packaging Electronic Circuits
2215 Sanders Road • Northbrook, IL 60062-6135
Material in this Test Methods Manual was voluntarily established by Technical Committees of the IPC. This material is advisory only
and its use or adaptation is entirely voluntary. IPC disclaims all liability of any kind as to the use, application, or adaptation of this
material. Users are also wholly responsible for protecting themselves against all claims or liabilities for patent infringement.
Equipment referenced is for the convenience of the user and does not imply endorsement by the IPC.
Page 1 of 1
Number
2.4.17
回
IPC-TM-650
TEST
METHODS
MANUAL
Subject
Tear
Strength
(Propagation)
Date
4/73
Revision
Originating
Task
Group
N/A
1
.0
Scope
This
method
is
to
determine
the
average
force
in
grams
required
to
propagate
tearing
through
a
specific
length
of
the
constant
radius
specimen.
Because
of
the
variation
of
materials
and
orientation
of
fibers,
the
method
has
been
designed
to
compensate
and
derive
acceptable
data.
2
.0
Applicable
Documents
Tear
Strength
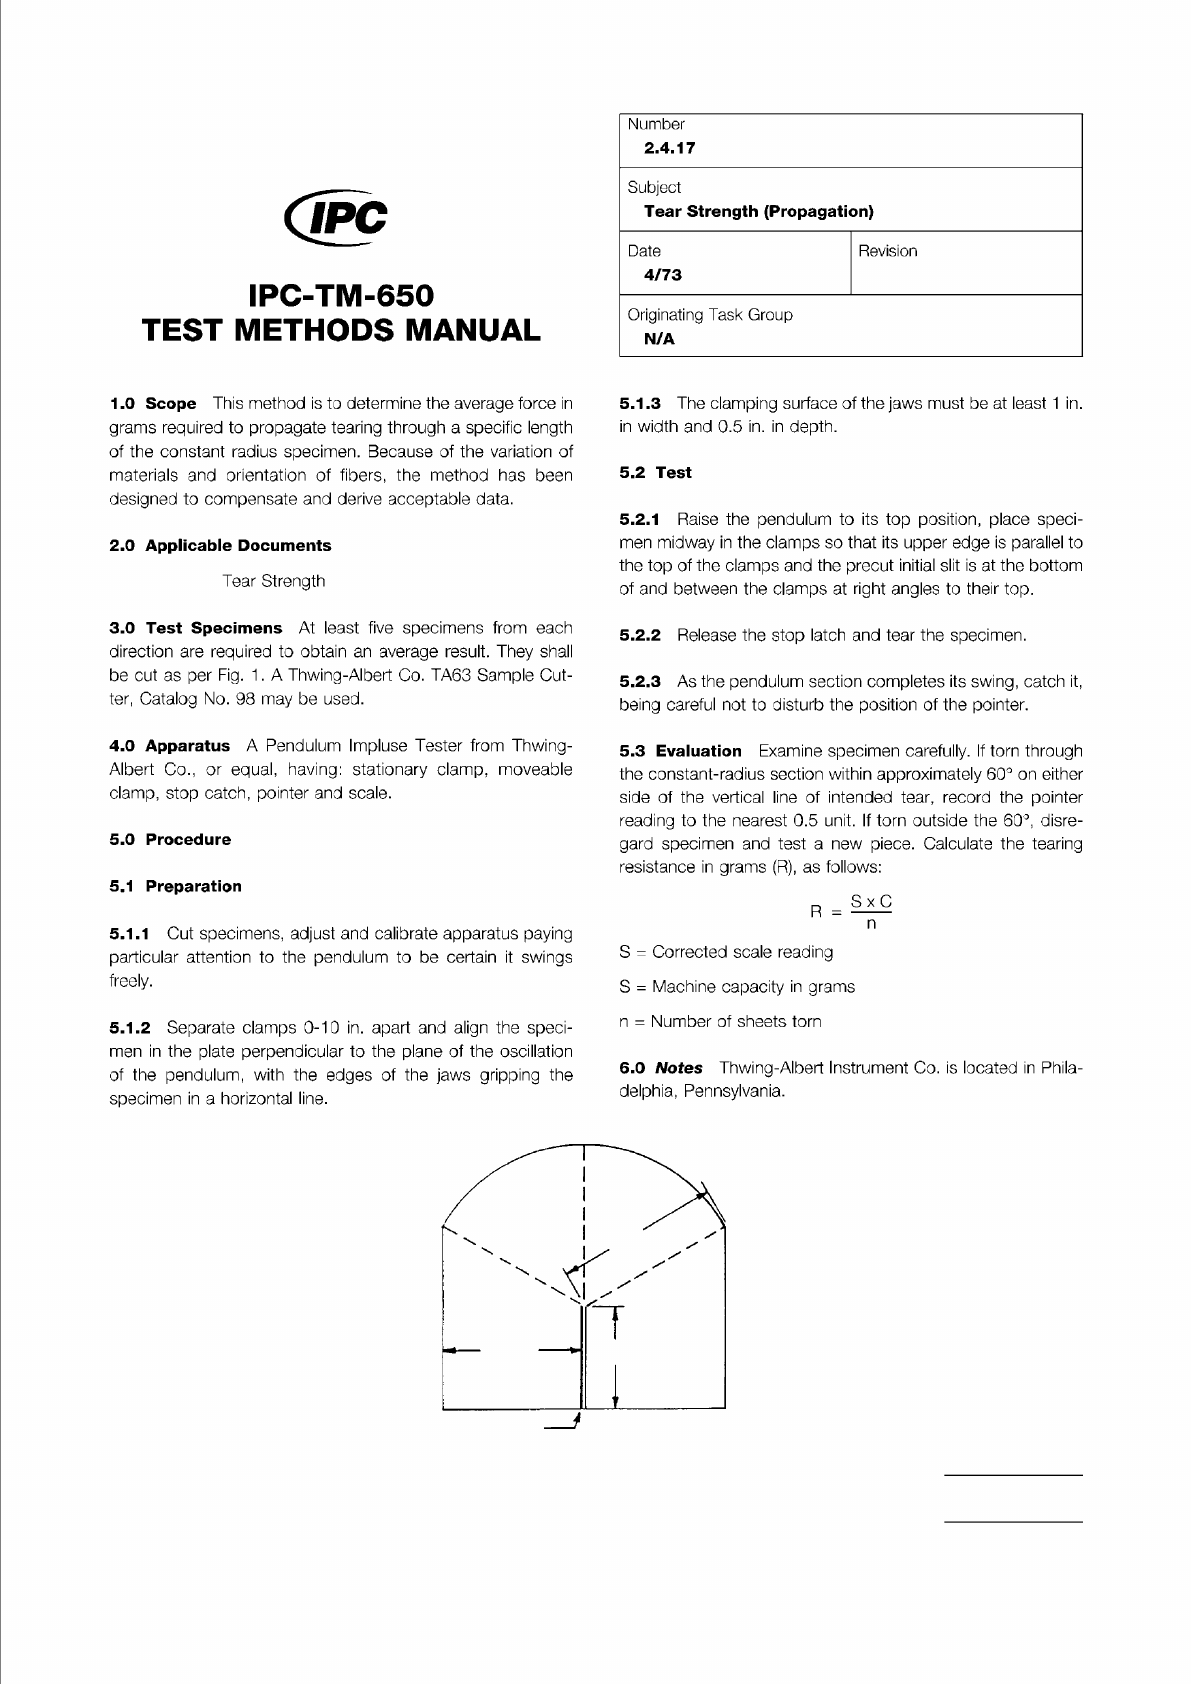
3
.0
Test
Specimens
At
least
five
specimens
from
each
direction
are
required
to
obtain
an
average
result.
They
shall
be
cut
as
per
Fig.
1
.
A
Thwing-Albert
Co.
TA63
Sample
Cut¬
ter,
Catalog
No.
98
may
be
used.
4
.0
Apparatus
A
Pendulum
Impluse
Tester
from
Thwing-
Albert
Co.,
or
equal,
having:
stationary
clamp,
moveable
clamp,
stop
catch,
pointer
and
scale.
5
.0
Procedure
5.1
Preparation
5.1.1
Cut
specimens,
adjust
and
calibrate
apparatus
paying
particular
attention
to
the
pendulum
to
be
certain
it
swings
freely.
5.1.2
Separate
clamps
0-10
in.
apart
and
align
the
speci¬
men
in
the
plate
perpendicular
to
the
plane
of
the
oscillation
of
the
pendulum,
with
the
edges
of
the
jaws
gripping
the
specimen
in
a
horizontal
line.
5.1.3
The
clamping
surface
of
the
jaws
must
be
at
least
1
in.
in
width
and
0.5
in.
in
depth.
5.2
Test
5.2.1
Raise
the
pendulum
to
its
top
position,
place
speci¬
men
midway
in
the
clamps
so
that
its
upper
edge
is
parallel
to
the
top
of
the
clamps
and
the
precut
initial
slit
is
at
the
bottom
of
and
between
the
clamps
at
right
angles
to
their
top.
5.2.2
Release
the
stop
latch
and
tear
the
specimen.
5.2.3
As
the
pendulum
section
completes
its
swing,
catch
it,
being
careful
not
to
disturb
the
position
of
the
pointer.
5.3
Evaluation
Examine
specimen
carefully.
If
torn
through
the
constant-radius
section
within
approximately
60°
on
either
side
of
the
vertical
line
of
intended
tear,
record
the
pointer
reading
to
the
nearest
0.5
unit.
If
torn
outside
the
60°,
disre¬
gard
specimen
and
test
a
new
piece.
Calculate
the
tearing
resistance
in
grams
(R),
as
follows:
R
二
n
S
=
Corrected
scale
reading
S
二
Machine
capacity
in
grams
n
=
Number
of
sheets
torn
6
.0
Notes
Thwing-Albert
Instrument
Co.
is
located
in
Phila¬
delphia,
Pennsylvania.
IPC-TM-650
Number
Subject Date
Revision
Page 4 of 5
2.4.24.5
Glass
Transition
Temperature
and
Thermal
Expansion
of
Materials
Used
in
High
Density
Interconnection
(HDI)
and
Microvias
-
TMA
Method
11/98
a.
GTE
below
glass
transition:
(生-
0)106
a
但
-句二
L0(Tb
~
Ta)
For
most
materials,
this
will
be
in
the
range
of
7
ppm
to
50
ppm
(reinforced)
or
30
ppm
to
150
ppm
(unreinforced).
b.
GTE
above
glass
transition:
3
-
/_c)1
C)6
二
L
。"d
一
%)
For
most
materials,
this
will
be
in
the
range
of
50
ppm
to
100
ppm
(reinforced)
or
1
50
ppm
to
500
ppm
(un
reinforced).
Any
reinforced
materials,
where
the
reinforcement
has
a
negative
GTE,
will
shrink
rather
than
expand
when
heated
above
Tg
of
the
resin.
Where:
Ta
=
Temperature
at
point
A
in
Figure
2
Tb
=
Temperature
at
point
B
in
Figure
2
Tc
=
Temperature
at
point
C
in
Figure
2
Td
二
Temperature
at
point
D
in
Figure
2
Lo
=
Initial
Length
or
thickness
La
=
Length
or
thickness
at
point
A
in
Figure
2
Lb
=
Length
or
thickness
at
point
B
in
Figure
2
Lc
=
Length
or
thickness
at
point
C
in
Figure
2
Ld
=
Length
or
thickness
at
point
D
in
Figure
2
5.4.3
Instantaneous
Coefficient
of
Thermal
Expansion
Curve
(Optional)
The
instantaneous
GTE
expansion
curve
is
the
slope
of
the
TMA
expansion
curve
plotted
as
a
function
of
temperature.
Figure
3
shows
a
combined
expansion
curve
and
its
resulting
instantaneous
CTE
curve.
Instantaneous
CTE
(aTi)
is
calculated
at
each
temperature
(T)
from
the
slope
of
the
TMA
expansion
curve
(dL/dT)
at
that
temperature:
1
dL7dT
is
determined
at
each
temperature
(T)
from
the
L
vs.
T
curve
by:
国
二
化
/+1—
0)
同
-
(乙+1—
刀)
This
calculation
can
be
done
in
a
spreadsheet
that
contains
the
L
vs.
T
data.
Some
TMA
computer
analysis
software
per¬
forms
this
calculation
for
you.
For
an
example
of
plot
ar|Ti
vs
temperature,
see
Figure
3.
5.4.4
Percent
Thermal
Expansion
(PTE)
(Optional)
The
total
percent
of
thermal
expansion
is
calculated
as
follows:
(法
—
7~a)
Percent
TE
=
—
―
-
*
700
For
consistency,
it
is
recommended
that
the
TMA
computer
analysis
software
be
used
for
this
calculation.
5.5
Report
5.5.1
Report
the
glass
transition
temperature
of
each
speci¬
men,
rounding
to
the
nearest
whole
number.
5.5.2
Report
the
CTE
in
ppm/℃
above
and
below
Tg
and
the
temperature
ranges
over
which
the
thermal
expansion
was
determined.
For
Method
B,
report
x
and
y
CTE
values.
5.5.3
Optionally
report
the
PTE
in
percent
and
the
tempera¬
ture
ranges
over
which
the
thermal
expansion
was
deter¬
mined.
5.6
Plot
5.6.1
Plot
the
expansion
(pm)
vs.
temperature
(
℃)
for
the
specimen.
If
using
computer
based
analysis,
include
the
Tg
and
CTE
measurement
start
points
and
computer
generated
lines
(see
Figure
2).
5.6.2
Optionally
plot
the
instantaneous
CTE
(|jm/℃)
vs.
temperature
(
℃)
for
the
specimen
(see
Figure
3).
5.6.3
Optionally
plot
the
percent
expansion
vs.
temperature
(
℃)
for
the
specimen.
If
using
computer-based
analysis,
include
the
PTE
measurement
start
points
on
the
plot.
6.0
Notes
6.1
Calibration
of
the
TMA
must
be
carried
out
according
to
the
manufacturer's
instructions
for
both
probe
expansion
and
specimen
temperature.