IPC-TM-650 EN 2022 试验方法--.pdf - 第284页
7 Calculations 7.1 Low E xt ensible Films For base dielectric f ilms that have load-time charts characterized by Figure 2, the average tear propagation fo rce in gr ams [ounces] is obtained by av er- aging the load indic…
IPC-TM-650
Number
Subject Date
Revision
Page 4 of 5
2.4.24.5
Glass
Transition
Temperature
and
Thermal
Expansion
of
Materials
Used
in
High
Density
Interconnection
(HDI)
and
Microvias
-
TMA
Method
11/98
a.
GTE
below
glass
transition:
(生-
0)106
a
但
-句二
L0(Tb
~
Ta)
For
most
materials,
this
will
be
in
the
range
of
7
ppm
to
50
ppm
(reinforced)
or
30
ppm
to
150
ppm
(unreinforced).
b.
GTE
above
glass
transition:
3
-
/_c)1
C)6
二
L
。"d
一
%)
For
most
materials,
this
will
be
in
the
range
of
50
ppm
to
100
ppm
(reinforced)
or
1
50
ppm
to
500
ppm
(un
reinforced).
Any
reinforced
materials,
where
the
reinforcement
has
a
negative
GTE,
will
shrink
rather
than
expand
when
heated
above
Tg
of
the
resin.
Where:
Ta
=
Temperature
at
point
A
in
Figure
2
Tb
=
Temperature
at
point
B
in
Figure
2
Tc
=
Temperature
at
point
C
in
Figure
2
Td
二
Temperature
at
point
D
in
Figure
2
Lo
=
Initial
Length
or
thickness
La
=
Length
or
thickness
at
point
A
in
Figure
2
Lb
=
Length
or
thickness
at
point
B
in
Figure
2
Lc
=
Length
or
thickness
at
point
C
in
Figure
2
Ld
=
Length
or
thickness
at
point
D
in
Figure
2
5.4.3
Instantaneous
Coefficient
of
Thermal
Expansion
Curve
(Optional)
The
instantaneous
GTE
expansion
curve
is
the
slope
of
the
TMA
expansion
curve
plotted
as
a
function
of
temperature.
Figure
3
shows
a
combined
expansion
curve
and
its
resulting
instantaneous
CTE
curve.
Instantaneous
CTE
(aTi)
is
calculated
at
each
temperature
(T)
from
the
slope
of
the
TMA
expansion
curve
(dL/dT)
at
that
temperature:
1
dL7dT
is
determined
at
each
temperature
(T)
from
the
L
vs.
T
curve
by:
国
二
化
/+1—
0)
同
-
(乙+1—
刀)
This
calculation
can
be
done
in
a
spreadsheet
that
contains
the
L
vs.
T
data.
Some
TMA
computer
analysis
software
per¬
forms
this
calculation
for
you.
For
an
example
of
plot
ar|Ti
vs
temperature,
see
Figure
3.
5.4.4
Percent
Thermal
Expansion
(PTE)
(Optional)
The
total
percent
of
thermal
expansion
is
calculated
as
follows:
(法
—
7~a)
Percent
TE
=
—
―
-
*
700
For
consistency,
it
is
recommended
that
the
TMA
computer
analysis
software
be
used
for
this
calculation.
5.5
Report
5.5.1
Report
the
glass
transition
temperature
of
each
speci¬
men,
rounding
to
the
nearest
whole
number.
5.5.2
Report
the
CTE
in
ppm/℃
above
and
below
Tg
and
the
temperature
ranges
over
which
the
thermal
expansion
was
determined.
For
Method
B,
report
x
and
y
CTE
values.
5.5.3
Optionally
report
the
PTE
in
percent
and
the
tempera¬
ture
ranges
over
which
the
thermal
expansion
was
deter¬
mined.
5.6
Plot
5.6.1
Plot
the
expansion
(pm)
vs.
temperature
(
℃)
for
the
specimen.
If
using
computer
based
analysis,
include
the
Tg
and
CTE
measurement
start
points
and
computer
generated
lines
(see
Figure
2).
5.6.2
Optionally
plot
the
instantaneous
CTE
(|jm/℃)
vs.
temperature
(
℃)
for
the
specimen
(see
Figure
3).
5.6.3
Optionally
plot
the
percent
expansion
vs.
temperature
(
℃)
for
the
specimen.
If
using
computer-based
analysis,
include
the
PTE
measurement
start
points
on
the
plot.
6.0
Notes
6.1
Calibration
of
the
TMA
must
be
carried
out
according
to
the
manufacturer's
instructions
for
both
probe
expansion
and
specimen
temperature.
7 Calculations
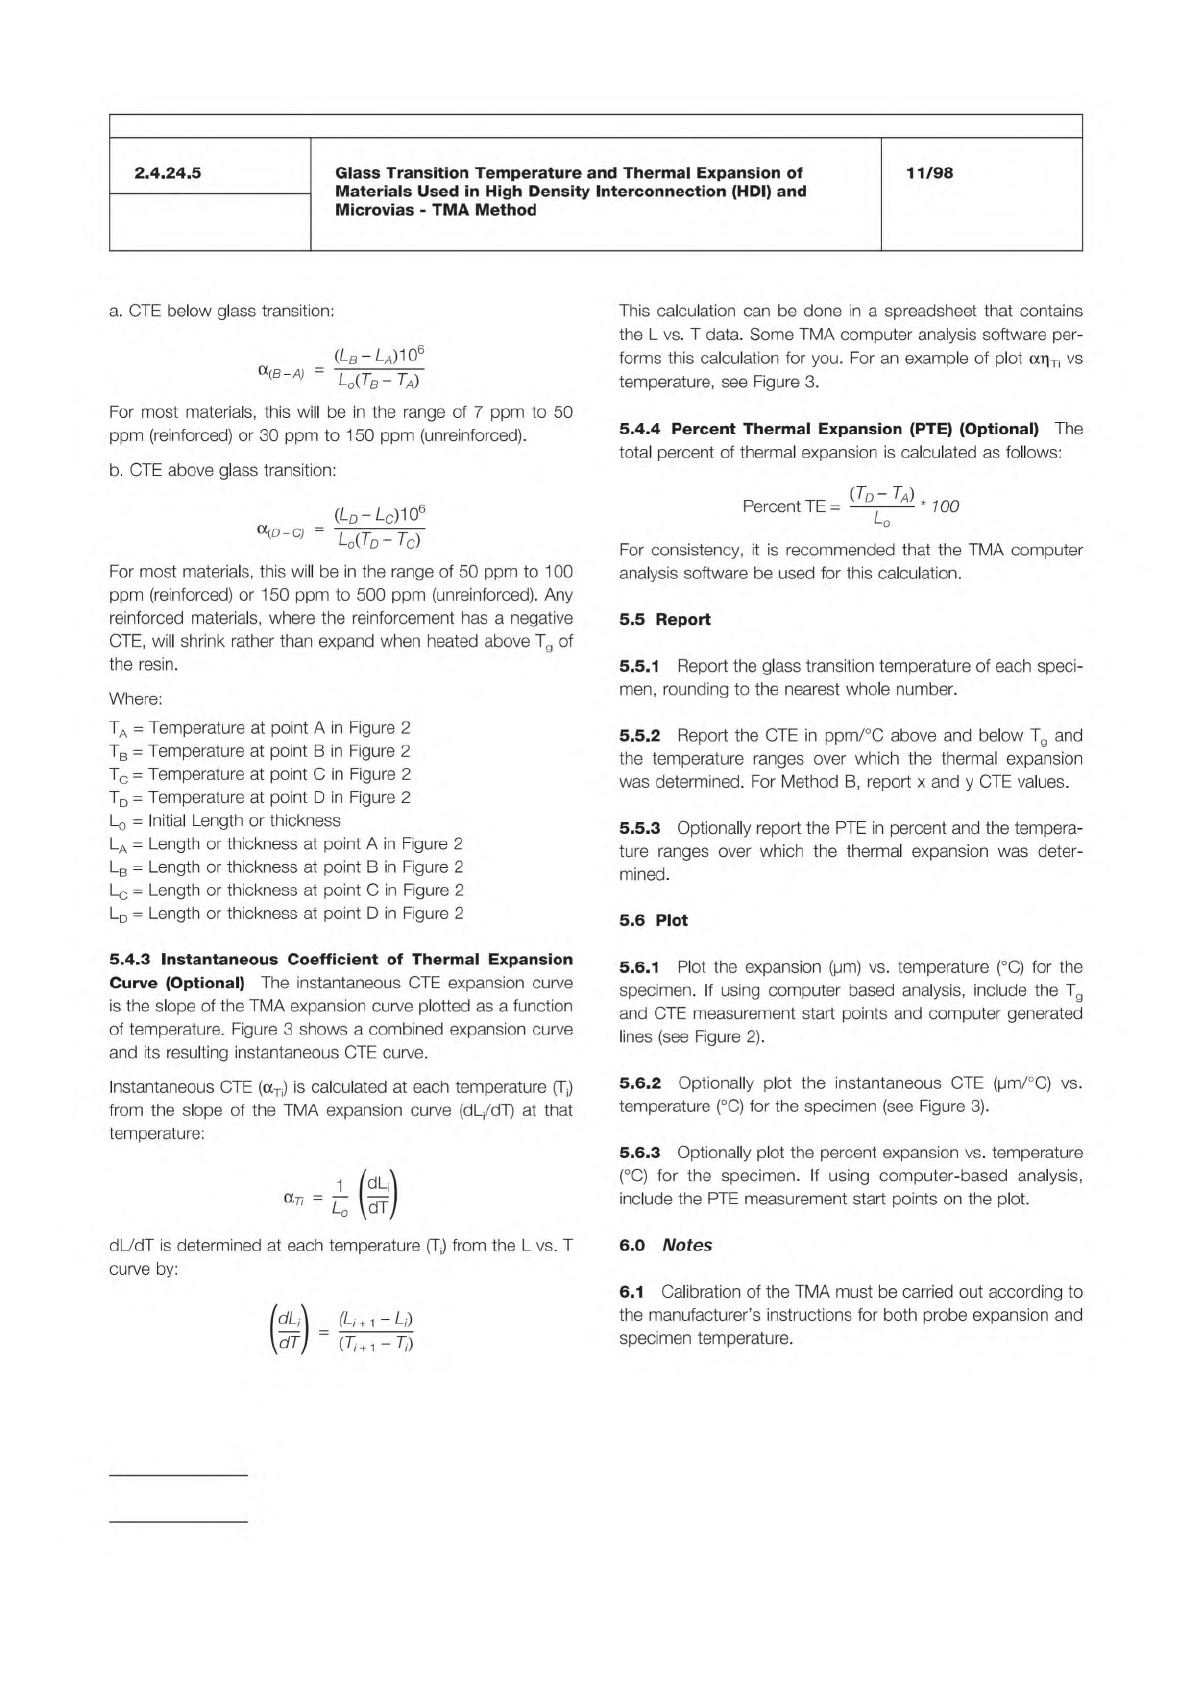
7.1 Low Extensible Films
For base dielectric films that
have load-time charts characterized by Figure 2, the average
tear propagation force in grams [ounces] is obtained by aver-
aging the load indicated on the chart over the time period,
disregarding the initial and final portions of the curve. Record
the average load value reading from the tensile testing
machine. The average resistance to tearing
be calcu-
lated from all specimens tested in each of the transverse and
longitudinal directions.
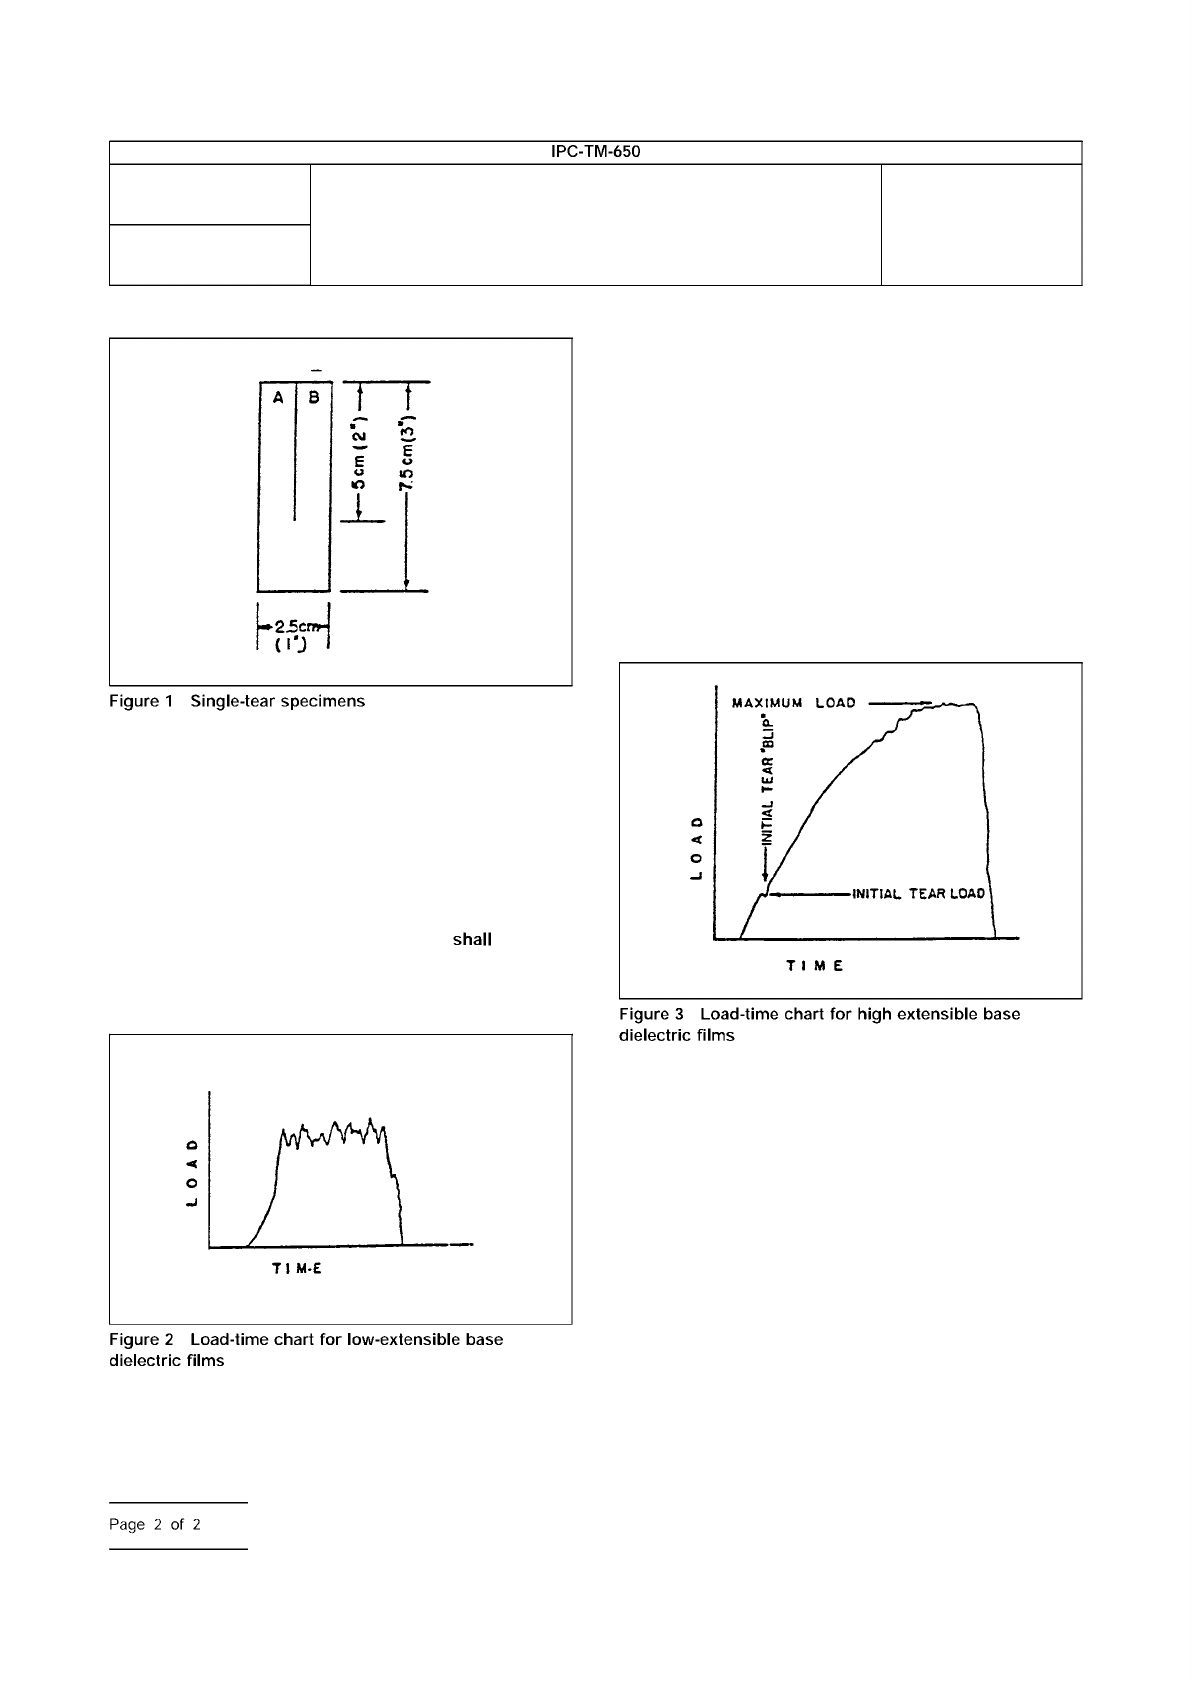
7.2 High Extensible Films
For base dielectric films that
have load-time charts characterized by Figure 3, the initial
force to continue the propagation of the slit and the maximum
force attained are obtained from the chart and reported in
grams [ounces]. The initial force may be more readily detected
by placing a dot approximately 3 mm [1/8 in] in diameter at
the base of the razor blade slit with a wax pencil. As the load
is applied to the sample, the dot area is observed. When the
load is just sufficient to begin the extension of the slit, a ‘‘blip’’
is introduced on the chart (see Figure 3) by pushing the
appropriate button on the recorder or the equivalent to mark
this point. The maximum load is the highest reading on the
chart as indicated. Calculate the average of the five initial tear-
propagation forces and the average of the five maximum tear-
propagation forces in grams [ounces] for the transverse and
longitudinal directions of the material test specimens.
8 Report
8.1
Report the average base dielectric film thickness only of
the specimens tested. This provides the user of this test
method with the base dielectric film thickness only, if required,
by the flexible circuitry material specifications.
8.2
For low extensible base dielectric films described in 7.1,
report the average of the five average tear propagation deter-
minations in grams [ounces] for the transverse and longitudi-
nal specimens.
8.3
For high extensible base dielectric films described in 7.2,
report the average of the five initial tear-propagation forces
and the average of the five maximum tear-propagation forces
in grams [ounces] for the transverse and longitudinal
specimens.
IPC-24171-1
IPC-24171-2
IPC-24171-3
Number
2.4.17.1
Subject
Propagation Tear Strength, Flexible Insulating Material
Date
1/13
Revision
B
MAXIMUM
LOAD
INITIAL
TEAR
LOAD
TIME
Figure
1
Single-tear
specimens
shall
Figure
3
Load-time
chart
for
high
extensible
base
dielectric
films
Figure
2
Load-time
chart
for
low-extensible
base
dielectric
films
IPC-TM-650
—
-
Fam
WEN_
Page
2
of
2
ASTM-E-345
The Institute for Interconnecting and Packaging Electronic Circuits
2215 Sanders Road • Northbrook, IL 60062-6135
Material in this Test Methods Manual was voluntarily established by Technical Committees of the IPC. This material is advisory only
and its use or adaptation is entirely voluntary. IPC disclaims all liability of any kind as to the use, application, or adaptation of this
material. Users are also wholly responsible for protecting themselves against all claims or liabilities for patent infringement.
Equipment referenced is for the convenience of the user and does not imply endorsement by the IPC.
Page 1 of 2
IPC-TM-650
TEST
METHODS
MANUAL
1
.0
Scope
To
determine
the
tensile
strength
(in
PSI)
and
the
elongation
(in
percentage)
of
copper
foil
at
ambient
and
elevated
temperatures
by
mechanical
force
testing.
2
.0
Applicable
Documents
Tensile
Strength
3
.0
Test
Specimens
Copper
foil
sufficient
in
size
to
permit
cutting
or
etching
of
five
specimens
10
inches
x
眩
inch.
Specimens
must
be
clean
cut
and
free
of
burrs
and
nicks.
4
.0
Apparatus
4.1
Constant
strain
rate
tensile
tester
capable
of
pulling
at
rate
of
0.050
and
2.0
inches/minute.
4.2
J
DC
#50
sample
cutter
inch
wide
x
10
inches
long.
4.3
A
shear
to
cut
10
inches
long
sample
to
6
inches
long.
4.4
Mettler
Balance
type
P120
or
equivalent.
4.5
Elevated
temperature
chamber
or
fixture,
attachable
to
the
tensile
tester,
capable
of
reaching
and
maintaining
a
tem¬
perature
of
180℃
±10℃
during
sample
testing.
5
.0
Procedure
5.1
Preparation
of
Samples
5.1.1
The
sample
should
be
smooth
and
undistorted
(wrinkle
free).
5.1.2
Use
the
JDC
#50
to
cut
five
tensile
specimens.
5.1.3
Cut
the
five
10
inches
long
specimens
to
6
inches
long.
Note:
Accuracy
is
important
in
the
N
inch
x
6
inches
dimen¬
sions
because
it
is
used
to
determine
foil
thickness
and
cross-
sectional
area.
Number
2.4.18
Subject
Tensile
Strength
and
Elongation,
Copper
Foil
Date
Revision
8/80
B
Originating
Task
Group
Printed
Board
Test
Methods
(7-1
1d)
5.2
Weighing
Samples
5.2.1
Weigh
tensile
sample
to
at
least
three
places
beyond
the
decimal
point,
in
grams.
5.2.2
Record
the
weight
and
calculate
the
mean
average
cross-sectional
area.
Note:
The
density
of
electrodeposited
copper
is
8.909
gm/cc
(16.389
cc/in3
x
8.909
gm/cc
=
146
gm/in3).
The
density
of
rolled
copper
is
8.93
gm/cc
(1
6.389
cc/in3
x
8.93
gm/cc
=
146.35
gm/in3).
Weight
of
tensile
sample
in
grams
Mean
average
thickness
=
Area
of
Tensile
The
density
sample
in
sq.
X
of
copper
in
inches
gm/in3
Weight
of
tensile
sample
in
grams
Mean
avg.
cross-sectional
area
=
Area
of
Tensile
The
density
sample
in
sq.
X
of
copper
in
inches
gm/in3
5.3
General
Test
Information
5.3.1
If
the
tensile
tester
is
equipped
with
an
area
compen¬
sator,
dial
the
mean
average
cross-sectional
area
into
it.
If
not
then
the
cross-sectional
area
has
to
be
used
to
compute
the
tensile
strength.
Note:
Tensile
Strength
Load
used
to
break
sample
in
lbs.
in
lbs/in2
-
Mean
average
cross-sectional
area
If
Tensile
Tester
is
equipped
with
area
compensator
after
the
test
is
complete,
the
Tensile
Strength
can
be
read
directly
from
the
chart.
5.3.2
Ambient
Temperature
Testing
5.3.2.1
Select
load
range.
5.3.2.2
Place
the
sample
in
the
jaws
of
the
Tensile
Tester