IPC-TM-650 EN 2022 试验方法--.pdf - 第311页
Figure 1 IPC-TM-650 Number Subject Date Revision Page 2 of 3 2.4.24 Glass Transition Temperature and Z-Axis Thermal Expansion by TMA 12/94 C Temperature ℃ -*■ 250℃ [482°F] or other temperature as specified (such as, repr…
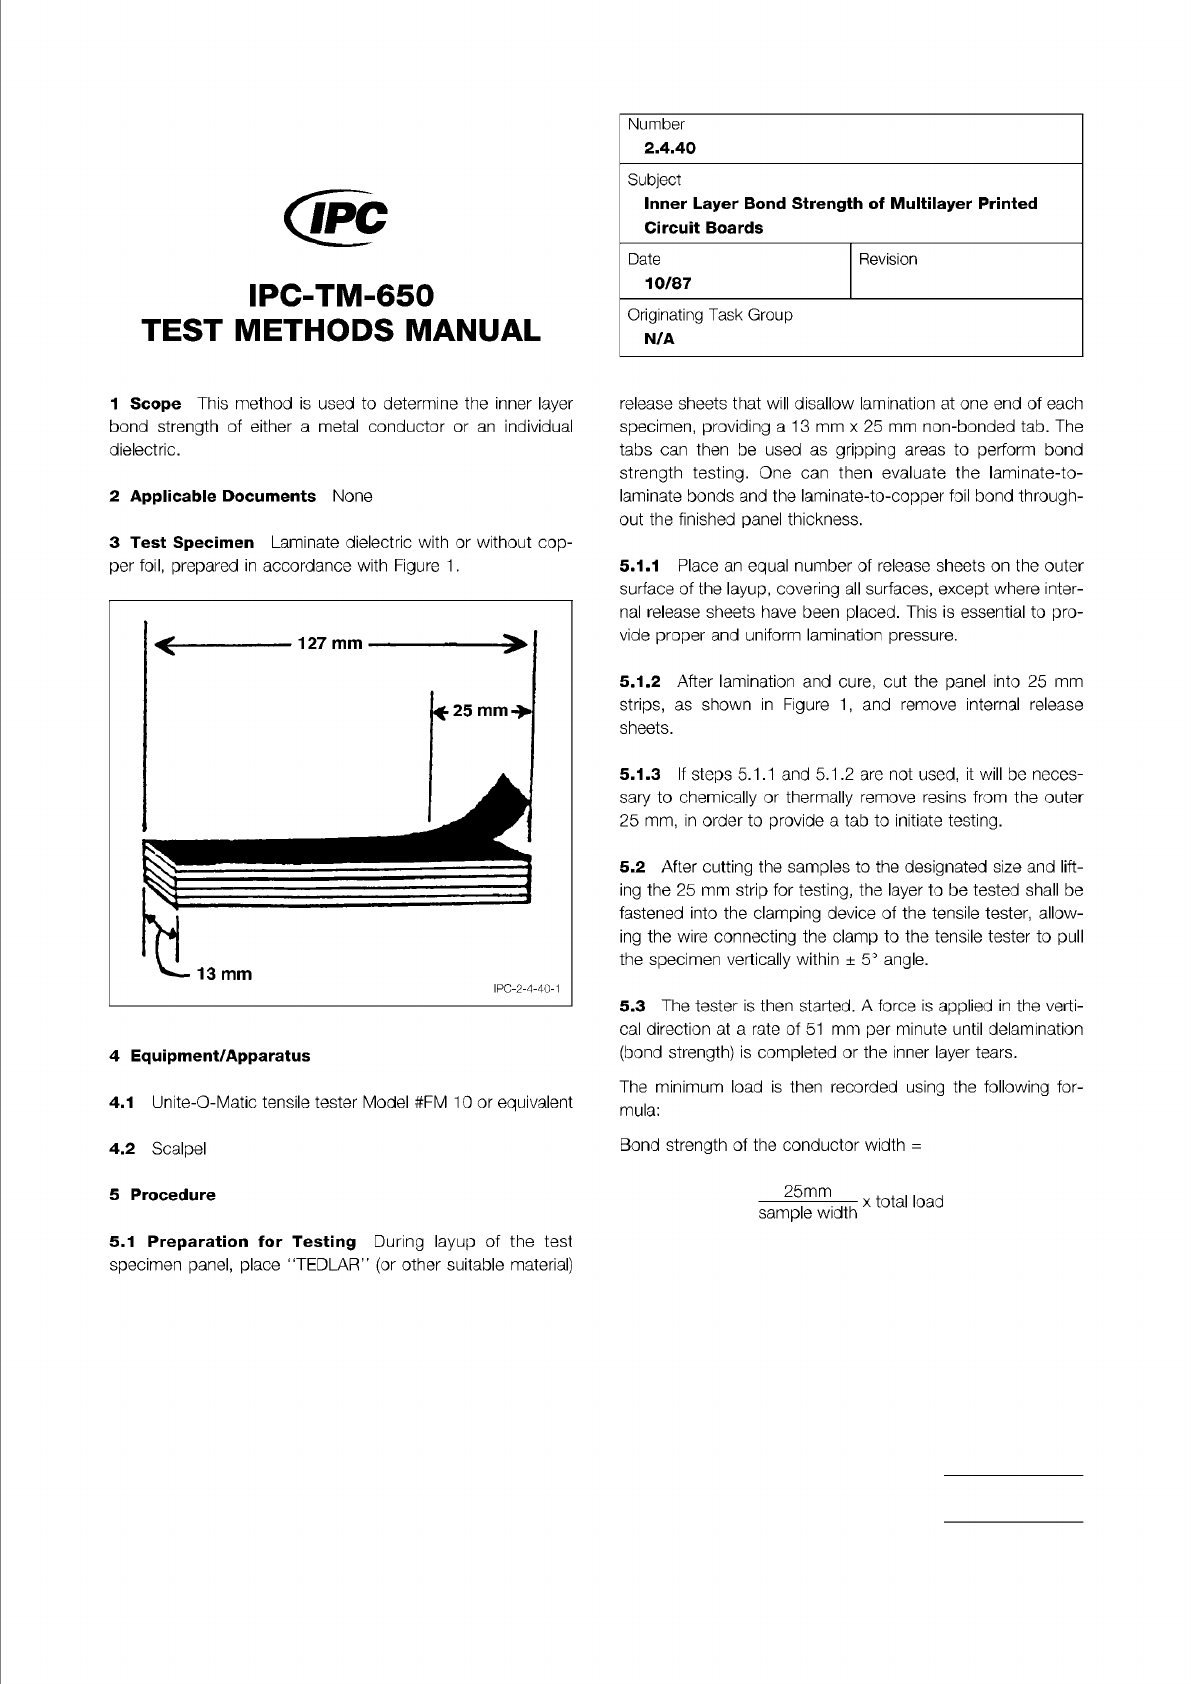
Figure 1 Laminate Dielectric
The Institute for Interconnecting and Packaging Electronic Circuits
2215 Sanders Road • Northbrook, IL 60062-6135
Material in this Test Methods Manual was voluntarily established by Technical Committees of the IPC. This material is advisory only
and its use or adaptation is entirely voluntary. IPC disclaims all liability of any kind as to the use, application, or adaptation of this
material. Users are also wholly responsible for protecting themselves against all claims or liabilities for patent infringement.
Equipment referenced is for the convenience of the user and does not imply endorsement by the IPC.
Page 1 of 1
IPC-TM-650
TEST
METHODS
MANUAL
1
Scope
This
method
is
used
to
determine
the
inner
layer
bond
strength
of
either
a
metal
conductor
or
an
individual
dielectric.
2
Applicable
Documents
None
3
Test
Specimen
Laminate
dielectric
with
or
without
cop¬
per
foil,
prepared
in
accordance
with
Figure
1
.
4
Equipment/Apparatus
4.1
Unite-O-Matic
tensile
tester
Model
#FM
10
or
equivalent
4.2
Scalpel
5
Procedure
Number
2.4.40
Subject
Inner
Layer
Bond
Strength
of
Multilayer
Printed
Circuit
Boards
Date
Revision
10/87
Originating
Task
Group
N/A
release
sheets
that
will
disallow
lamination
at
one
end
of
each
specimen,
providing
a
13
mm
x
25
mm
non-bonded
tab.
The
tabs
can
then
be
used
as
gripping
areas
to
perform
bond
strength
testing.
One
can
then
evaluate
the
laminate-to-
laminate
bonds
and
the
laminate-to-copper
foil
bond
through¬
out
the
finished
panel
thickness.
5.1.1
Place
an
equal
number
of
release
sheets
on
the
outer
surface
of
the
layup,
covering
all
surfaces,
except
where
inter¬
nal
release
sheets
have
been
placed.
This
is
essential
to
pro¬
vide
proper
and
uniform
lamination
pressure.
5.1.2
After
lamination
and
cure,
cut
the
panel
into
25
mm
strips,
as
shown
in
Figure
1
,
and
remove
internal
release
sheets.
5.1.3
If
steps
5.1.1
and
5.1
.2
are
not
used,
it
will
be
neces¬
sary
to
chemically
or
thermally
remove
resins
from
the
outer
25
mm,
in
order
to
provide
a
tab
to
initiate
testing.
5.2
After
cutting
the
samples
to
the
designated
size
and
lift¬
ing
the
25
mm
strip
for
testing,
the
layer
to
be
tested
shall
be
fastened
into
the
clamping
device
of
the
tensile
tester,
allow¬
ing
the
wire
connecting
the
clamp
to
the
tensile
tester
to
pull
the
specimen
vertically
within
±
5°
angle.
5.3
The
tester
is
then
started.
A
force
is
applied
in
the
verti¬
cal
direction
at
a
rate
of
51
mm
per
minute
until
delamination
(bond
strength)
is
completed
or
the
inner
layer
tears.
The
minimum
load
is
then
recorded
using
the
following
for¬
mula:
Bond
strength
of
the
conductor
width
二
25mm
sample
width
x
total
load
5.1
Preparation
for
Testing
During
layup
of
the
test
specimen
panel,
place
llTEDLAR"
(or
other
suitable
material)
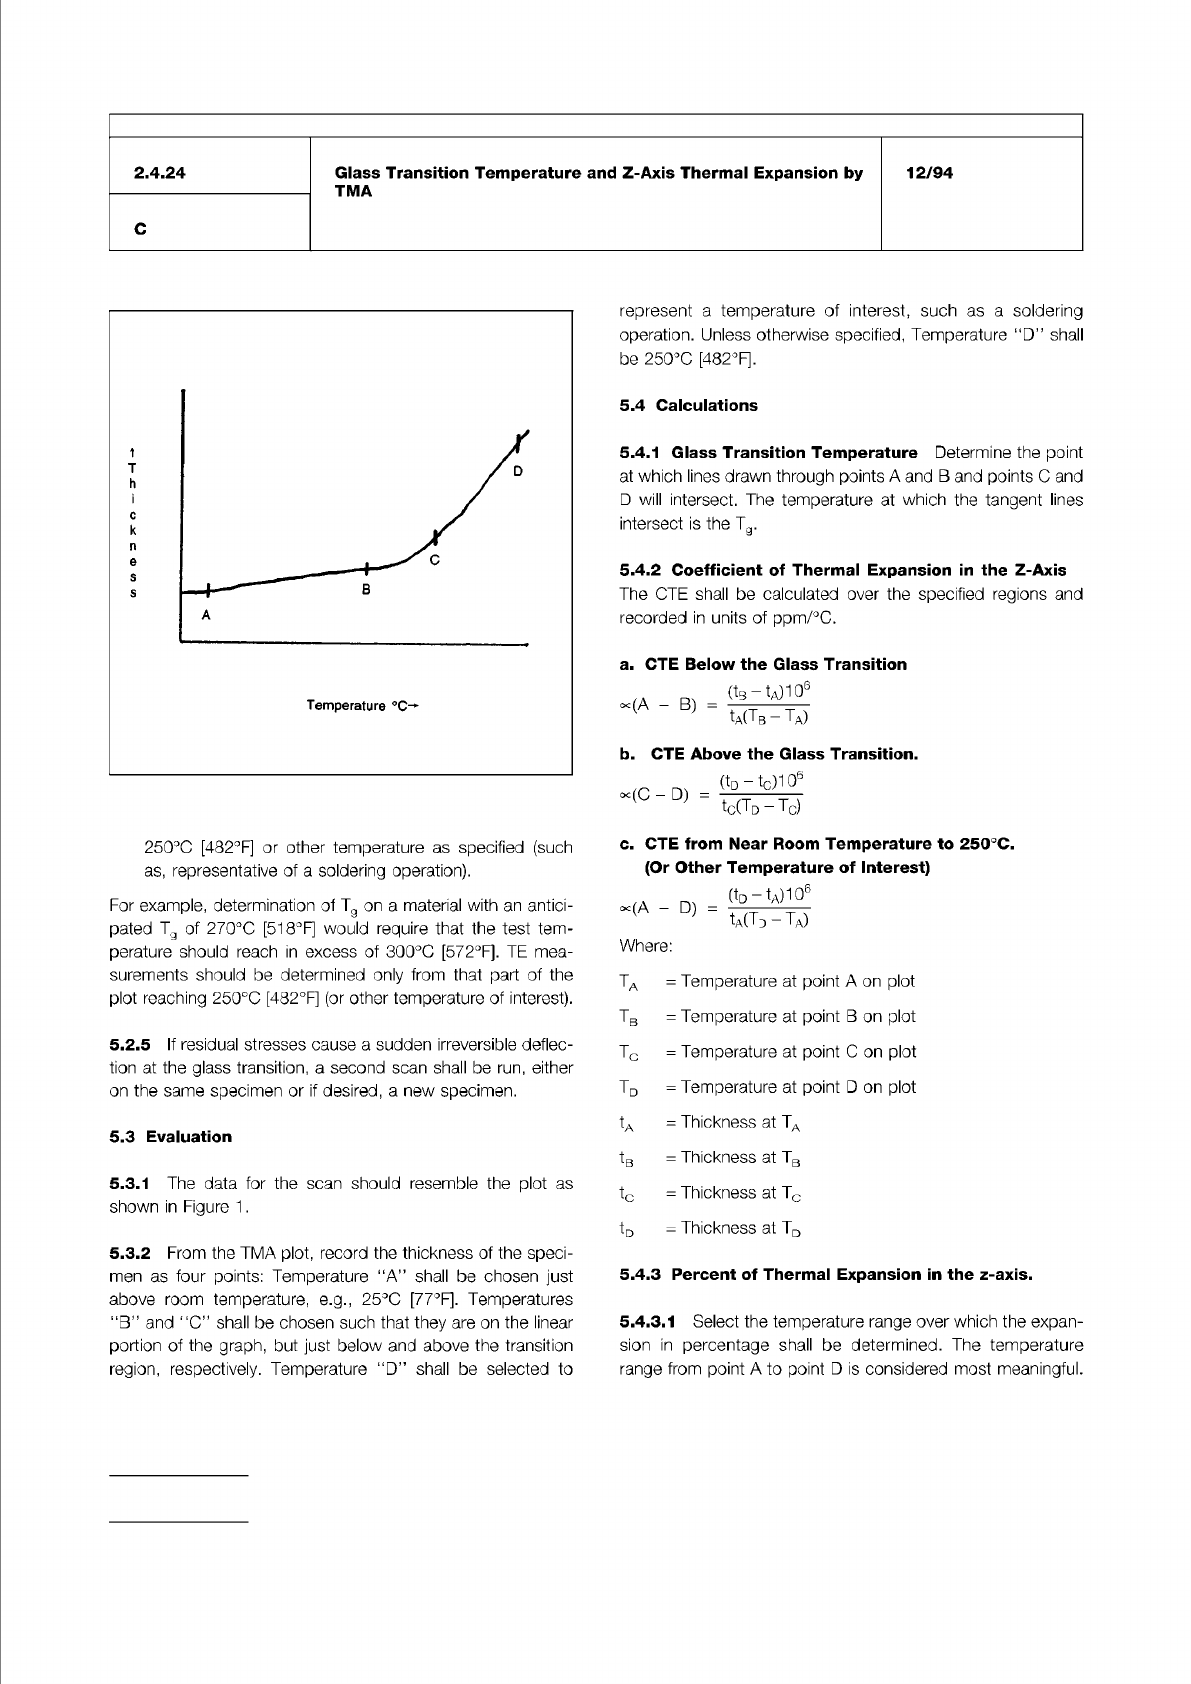
Figure 1
IPC-TM-650
Number
Subject Date
Revision
Page 2 of 3
2.4.24
Glass
Transition
Temperature
and
Z-Axis
Thermal
Expansion
by
TMA
12/94
C
Temperature
℃
-*■
250℃
[482°F]
or
other
temperature
as
specified
(such
as,
representative
of
a
soldering
operation).
For
example,
determination
of
Tg
on
a
material
with
an
antici¬
pated
Tg
of
270℃
[518°F]
would
require
that
the
test
tem¬
perature
should
reach
in
excess
of
300℃
[572°F].
TE
mea¬
surements
should
be
determined
only
from
that
part
of
the
plot
reaching
250℃
[482°F]
(or
other
temperature
of
interest).
5.2.5
If
residual
stresses
cause
a
sudden
irreversible
deflec¬
tion
at
the
glass
transition,
a
second
scan
shall
be
run,
either
on
the
same
specimen
or
if
desired,
a
new
specimen.
5.3
Evaluation
5.3.1
The
data
for
the
scan
should
resemble
the
plot
as
shown
in
Figure
1
.
5.3.2
From
the
TMA
plot,
record
the
thickness
of
the
speci¬
men
as
four
points:
Temperature
"A''
shall
be
chosen
just
above
room
temperature,
e.g.,
25℃
[77°F]-
Temperatures
“B”
and
<lC"
shall
be
chosen
such
that
they
are
on
the
linear
portion
of
the
graph,
but
just
below
and
above
the
transition
region,
respectively.
Temperature
"D”
shall
be
selected
to
represent
a
temperature
of
interest,
such
as
a
soldering
operation.
Unless
otherwise
specified,
Temperature
"D”
shall
be
250℃
[482°F].
5.4
Calculations
5.4.1
Glass
Transition
Temperature
Determine
the
point
at
which
lines
drawn
through
points
A
and
B
and
points
C
and
D
will
intersect.
The
temperature
at
which
the
tangent
lines
intersect
is
the
Tg.
5.4.2
Coefficient
of
Thermal
Expansion
in
the
Z-Axis
The
CTE
shall
be
calculated
over
the
specified
regions
and
recorded
in
units
of
ppm/℃.
a.
CTE
Below
the
Glass
Transition
c<(A
—
B)
=
WTb
-
ta)
b.
CTE
Above
the
Glass
Transition.
x(C
-
D)
Od
-
砂
06
忆(丁口
一
%)
c.
CTE
from
Near
Room
Temperature
to
250℃.
(Or
Other
Temperature
of
Interest)
oc(A
-
D)
=
«D
-
tA*。'
^a(Td
-
Ta)
Where:
Ta
=
Temperature
at
point
A
on
plot
Tb
=
Temperature
at
point
B
on
plot
Tc
=
Temperature
at
point
C
on
plot
Td
=
Temperature
at
point
D
on
plot
tA
=
Thickness
at
TA
tB
=
Thickness
at
TB
tc
=
Thickness
at
Tc
tD
二
Thickness
at
TD
5.4.3
Percent
of
Thermal
Expansion
in
the
z-axis.
5.4.3.1
Select
the
temperature
range
over
which
the
expan¬
sion
in
percentage
shall
be
determined.
The
temperature
range
from
point
A
to
point
D
is
considered
most
meaningful.
Note 2—
Note 3—
Note 4—
Note 5—
Note 6—
Note 7—
IPC-TM-650
Number
Subject Date
Revision
Page 2 of 3
2.4.41
Coefficient
of
Linear
Thermal
Expansion
of
Electrical
Insulating
Materials1
3/86
Instruments
from
du
Pont
and
Perkin
Elmer
have
been
found
suitable.
6
.0
Test
Specimens
6.1
The
test
specimen
shall
be
between
.05
and
0.3
inches
thick.
This
thickness
may
be
as
received
or
may
be
laminated
by
the
user
from
pre-impregnated
"B”
stage
and
copper
free
“C”
stage
material.
It
laminated
by
the
user,
the
user
shall
be
responsible
to
contact
the
manufacturer
for
the
exact
layup
and
process
parameters
used
for
quality
acceptance
at
the
manufacturers
facility.
Repeatability
of
Test
Results
will
vary
with
layup,
bake
out,
laminating
pressure/ramp
speed,
press
time,
etc.
6.2
Specimens
should
be
between
0.3
and
0.4
inches
in
height
and
have
flat
and
parallel
upper
and
lower
surfaces.
The
surfaces
to
be
measured
shall
be
perpendicular
to
the
fiber
fillers
and
the
identity
of
the
direction
of
the
fiber
fillers
shall
be
maintained
throughout
the
test.
The
upper
and
lower
surfaces
shall
be
polished
with
600
grit
paper
to
remove
burrs
or
strands
of
fiber
filler.
The
specimens
shall
then
be
cleaned
using
isopropyl
alcohol,
and
dried
for
1
hour
at
10℃
above
the
maximum
specified
temperature
of
the
run.
The
1
hour
prebake
may
be
eliminated
if
Condition
(7.),
is
performed
immediately
after
final
polish.
6.3
There
shall
be
three
specimens
prepared
from
the
same
piece
of
material
for
each
direction
to
be
measured.
7
.0
Conditioning
7.1
Conditioning
of
test
specimen
shall
include
immersion
in
isopropyl
alcohol
with
agitation
for
20
seconds,
followed
by
Condition
E-1/1
10
and
C-|
40/23/50
in
accordance
with
D-618.
8
.0
Calibration
8.1
Calibrate
the
apparatus
in
accordance
with
the
instru¬
ment
manufacturer's
recommendations.
9
.0
Procedure
9.1
Measure
the
height
of
the
specimen.
9.2
Place
the
specimen
in
the
specimen
holder
under
the
probe.
The
thermocouple
or
other
means
for
sensing
speci¬
men
temperature
should
be
in
contact
with
the
specimen,
or
as
near
to
the
specimen
as
possible.
9.3
Assemble
the
furnace
to
the
specimen
holder.
If
mea¬
surements
at
subambient
temperatures
are
to
be
made,
cool
the
specimen
holder
and
furnace
to
at
least
20℃
below
the
lowest
temperature
of
interest,
using
procedures
as
given
by
the
instrument
manufacturer.
The
refrigerant
used
for
cooling
shall
not
come
into
direct
contact
with
the
specimen.
The
temperature
range
to
be
tested
shall
be
speci¬
fied
by
the
user,
so
that
the
manufacturer
and
user
will
test
over
the
same
temperature
range.
If
tested
over
different
tem¬
perature
ranges,
the
repeatability
may
be
unacceptable.
9.4
Place
weights
on
the
sensing
probe
to
ensure
that
the
probe
is
in
contact
with
the
specimen
with
a
1
to
3-g
load.
9.5
Increase
the
furnace
temperature
at
5
=
0.5℃/min.
over
the
desired
temperature
range.
9.6
Record
the
specimen
temperature
and
change
in
speci¬
men
height
using
appropriate
ranges
on
the
X-Y
recorder.
A
gas
purge
may
be
used
to
replace
the
air
around
the
specimen
for
measurement
of
expansion
in
different
atmo¬
spheres.
9.7
Test
at
least
three
specimens
of
the
same
material.
Retest
of
a
specimen
may
be
used
only
as
reference
and
shall
not
be
treated
as
an
independent
test
of
a
new
specimen.
10
.0
Calculation
10.1
Calculate
the
average
coefficient
of
thermal
expan¬
sions,
a,
over
the
temperature
intervals
of
interest
as
follows:
a
=
(
△
H/AT)/H
where:
H
二
original
height
of
specimen,
A
H
=
change
in
height
of
the
specimen
(in
the
same
units)
over
the
temperature
interval
AT,
and
AT
=
temperature
interval,
(see
Figure
1).
AH
and
AT
may
on
some
instruments
be
read
directly
from
the
recorder
chart.
On
other
instruments
con¬
stant
factors
may
need
to
be
applied
to
the
chart
readings
to
obtain
these
values.
11
.0
Report