IPC-TM-650 EN 2022 试验方法--.pdf - 第322页
Figure 4 DMA Plot f or Storage Modulus, Loss Mod ulus , and T an Delta o n One Plot Storage Modulus (MPa) Loss Modulus (MPa) T an Delta 200 150 100 50 0 -50 -100 10.0 100.0 1000.0 10000.0 0.90 0.75 0.60 0.45 0.30 0.15 0.…
ASTM D 3386
Figure 1
T
emperature (
C)
A
0
B
200
Extension
The Institute for Interconnecting and Packaging Electronic Circuits
2215 Sanders Road • Northbrook, IL 60062-6135
Material in this Test Methods Manual was voluntarily established by Technical Committees of the IPC. This material is advisory only
and its use or adaptation is entirely voluntary. IPC disclaims all liability of any kind as to the use, application, or adaptation of this
material. Users are also wholly responsible for protecting themselves against all claims or liabilities for patent infringement.
Equipment referenced is for the convenience of the user and does not imply endorsement by the IPC.
Page 1 of 2
IPC-TM-650
TEST
METHODS
MANUAL
1
.0
Scope
This
test
method
establishes
a
procedure
for
determining
the
in-plane
coefficient
of
linear
thermal
expan¬
sion
of
organic
films
from
0-200℃
using
thermal
mechanical
analysis
(TMA).
2
.0
Applicable
Documents
ASTM
D
618
Standard
Practice
for
Conditioning
Plastics
and
Electrical
Insulating
Materials
for
Testing
Standard
Test
Method
for
Coefficient
of
Lin¬
ear
Thermal
Expansion
of
Electrical
Insulating
Materials
3
.0
Test
Specimen
The
test
specimen
shall
consist
of
a
strip
15-20
mm
long
and
2
mm
wide
with
a
minimum
thick¬
ness
of
1
0
pm
and
maximum
thickness
of
200
pm.
4
.0
Apparatus
or
Material
Perkin-Elmer
TMA-7
with
a
film
fixture
in
extension
mode
or
equivalent
equipment
capable
of
handling
films
less
than
25
pm
thick.
5
.0
Procedure
5.1
The
test
specimens
should
be
conditioned
at
23
土
2
℃
and
50
±
5%
relative
humidity
for
not
less
than
24
hours
prior
to
testing.
Refer
to
ASTM
D
618.
5.2
Follow
the
manufacturer's
recommendations
for
equip¬
ment
startup
and
calibration.
5.2
Mount
the
test
specimen
in
the
film
holder.
The
sample
length
(between
the
grips)
should
be
between
11-13
mm.
Refer
to
ASTM
D
3386.
5.3
Set
the
force
at
30
mN.
5.4
Perform
a
prescan
by
heating
a
rate
of
20℃/min.
Under
inert
atmosphere
from
-10℃
to
either
10℃
above
the
mate¬
rial
glass
transition
temperature,
Tg,
or
10℃
below
the
mate¬
rial
decomposition
limit,
Tmax,
determined
using
nitrogen.
Tg
may
be
determined
using
IPC
Test
Methods
2.4.24.2,
2.4.24.3,
or
2.4.25.
5.5
Hold
the
temperature
for
60
min.
Number
2.4.41.3
Subject
In-Plane
Coefficient
of
Thermal
Expansion,
Organic
Films
Date
Revision
7/95
Originating
Task
Group
Deposited
Dielectric
Task
Group
(C-13a)
5.7
Hold
the
temperature
for
10
min.
5.8
Reheat
the
specimen
at
a
rate
of
5
℃/min
to
a
maximum
temperature
of
25℃
below
the
glass
transition
temperature
of
the
polymer
or
10℃
below
the
material
decomposition
limit,
Tmax,
determined
under
nitrogen.
Ar
least
two
temperature
scans
of
the
test
specimen
should
be
conducted
without
dis¬
turbing
the
specimen
in
the
TMA
to
confirm
repeatability
of
observed
test
results.
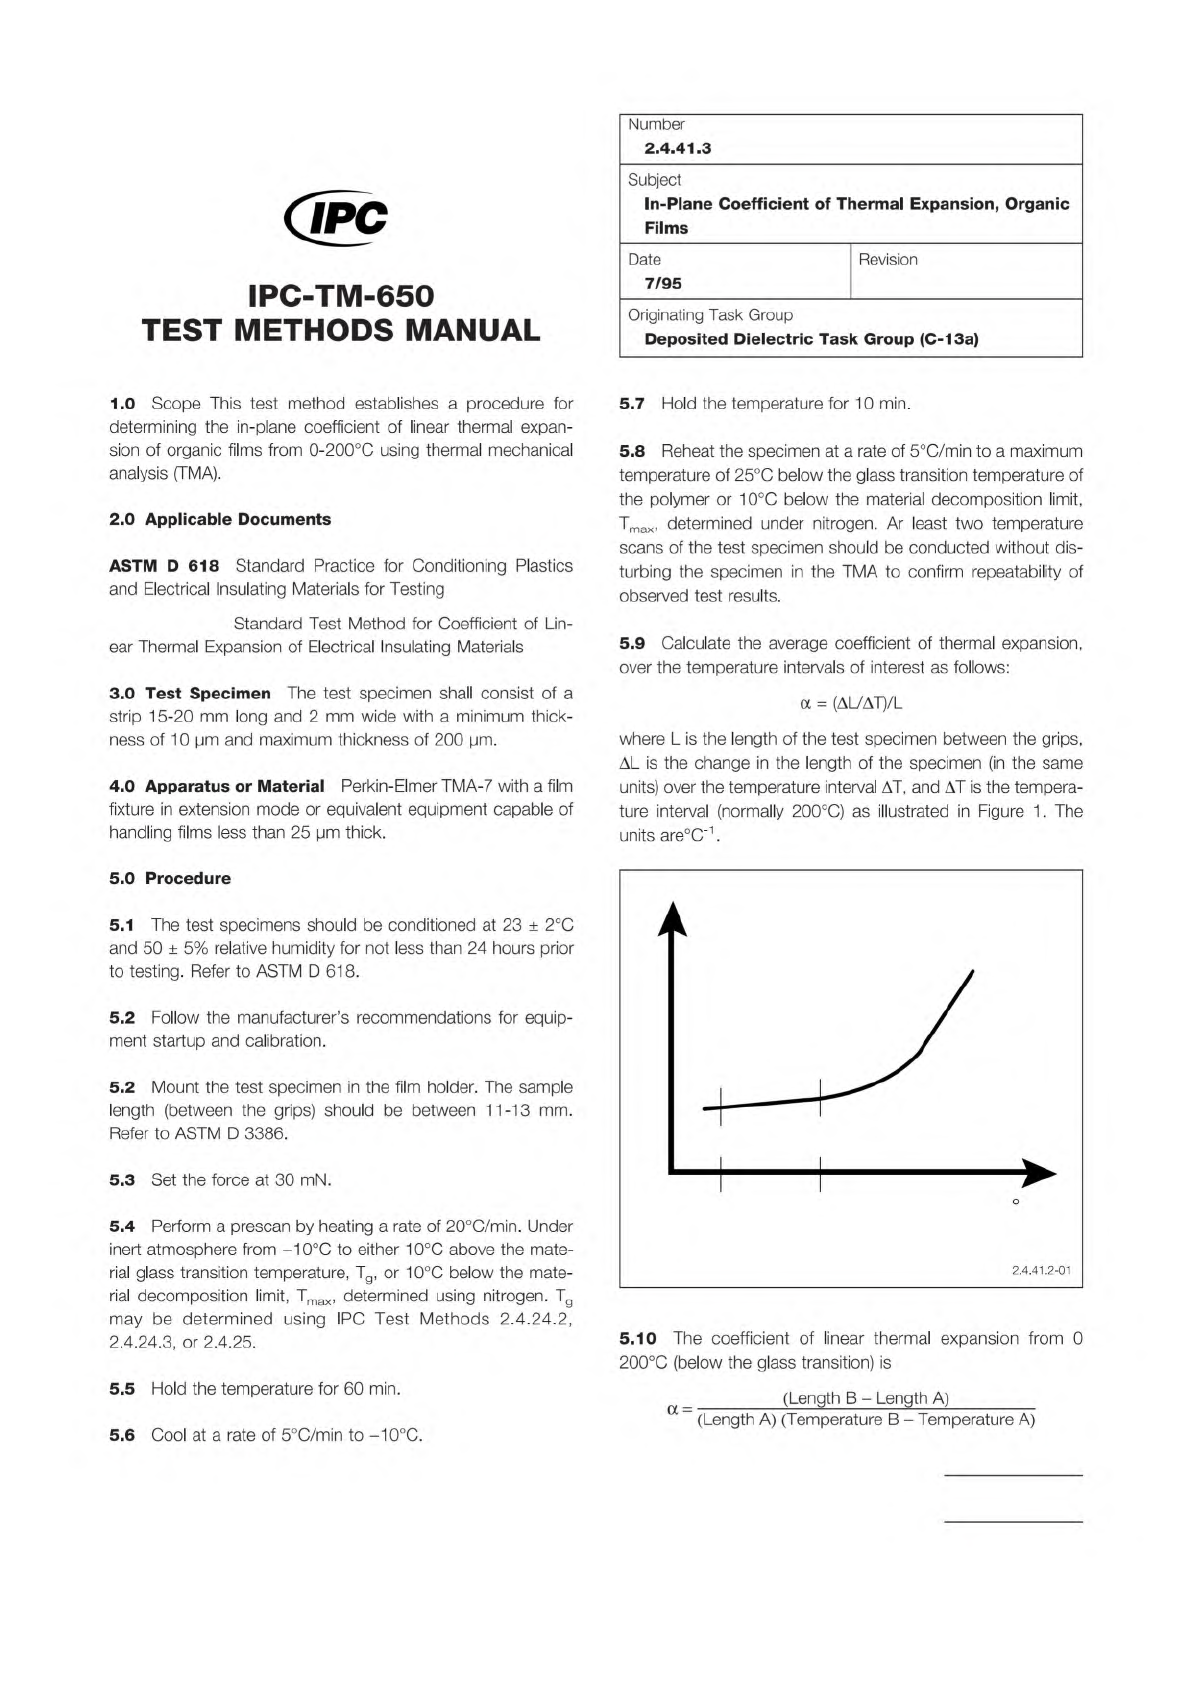
5.9
Calculate
the
average
coefficient
of
thermal
expansion,
over
the
temperature
intervals
of
interest
as
follows:
a
二
(AUAT)/L
where
L
is
the
length
of
the
test
specimen
between
the
grips,
AL
is
the
change
in
the
length
of
the
specimen
(in
the
same
units)
over
the
temperature
interval
AT,
and
AT
is
the
tempera¬
ture
interval
(normally
200℃)
as
illustrated
in
Figure
1.
The
units
are℃-1
.
5.10
The
coefficient
of
linear
thermal
expansion
from
0
200℃
(below
the
glass
transition)
is
(Length
B
-
Length
A)
-
(Length
A)
(Temperature
B
-
Temperature
A)
5.6
Cool
at
a
rate
of
5
℃/min
to
-10℃.
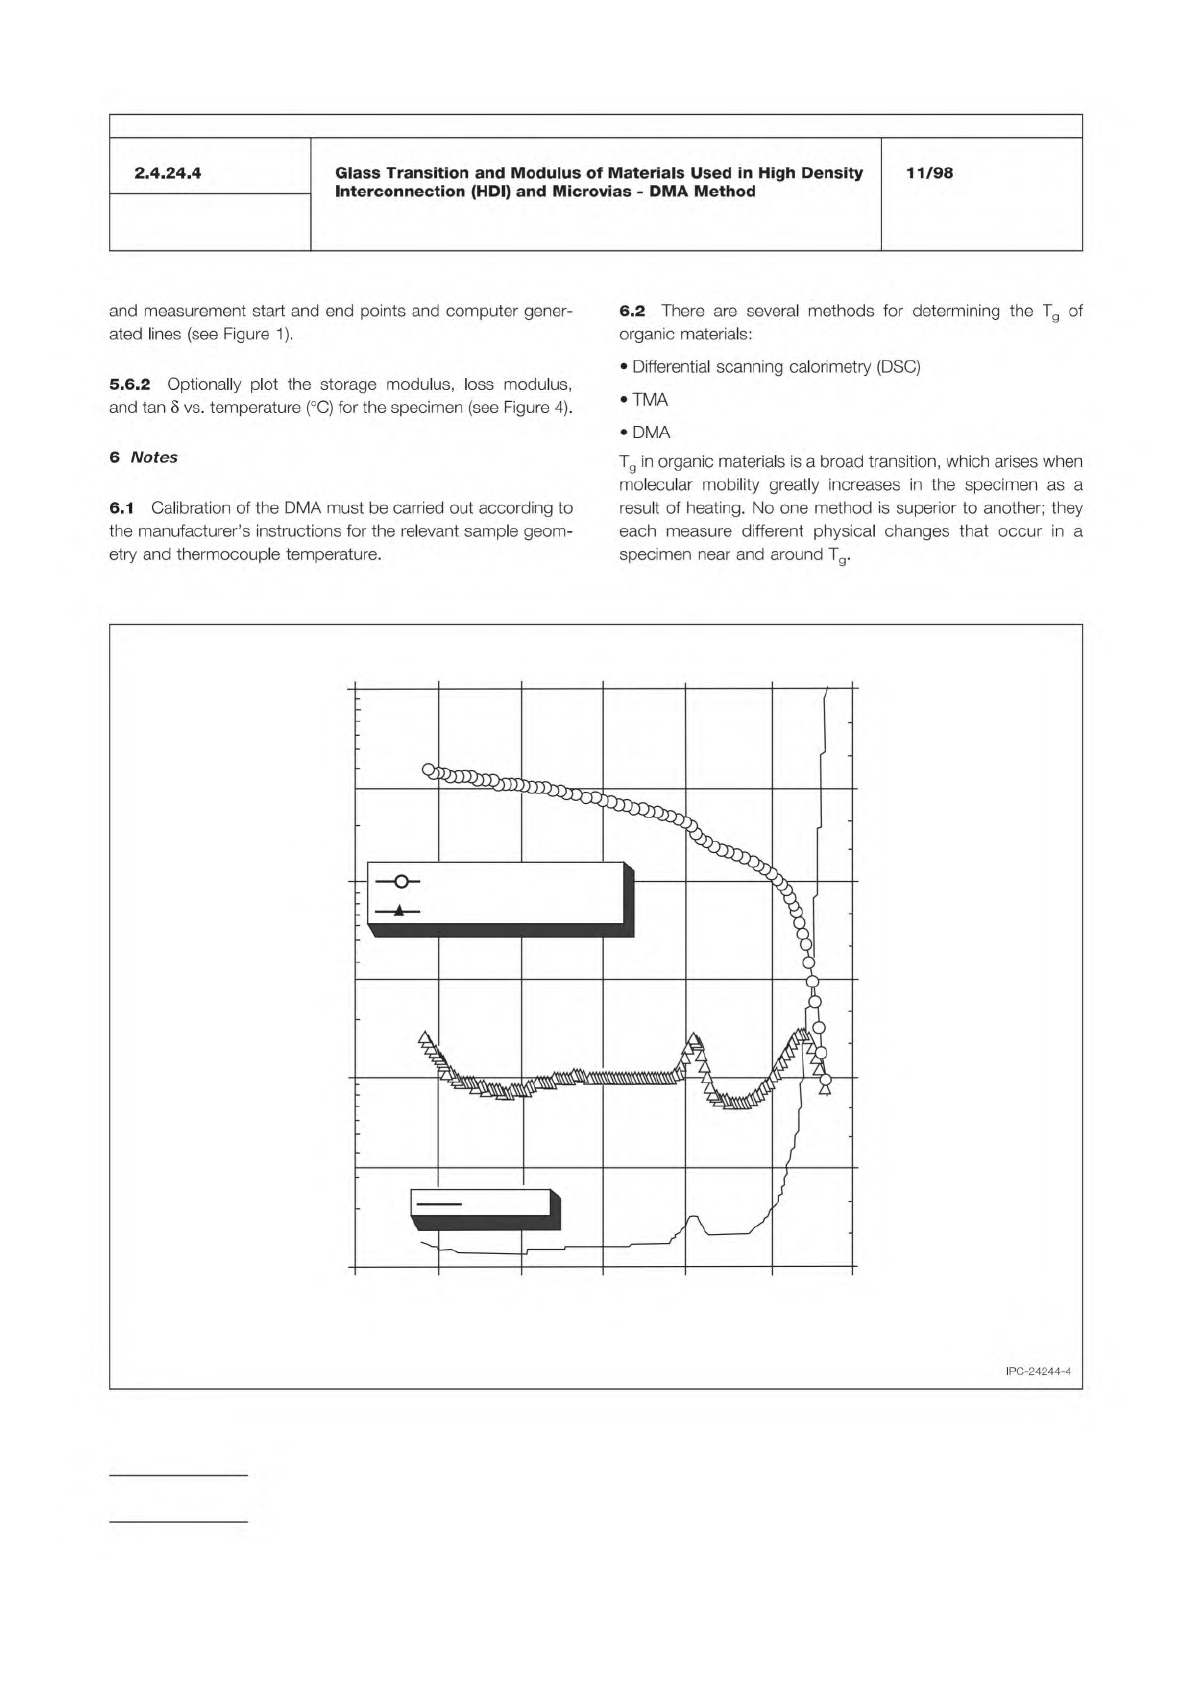
Figure 4 DMA Plot for Storage Modulus, Loss Modulus, and Tan Delta on One Plot
Storage Modulus (MPa)
Loss Modulus (MPa)
Tan Delta
200
150100
500
-50
-100
10.0
100.0
1000.0
10000.0
0.90
0.75
0.60
0.45
0.30
0.15
0.0
Temperature (
˚
C)
Storage Modulus (MPa)
Tan Delta
IPC-TM-650
Number
Subject Date
Revision
Page 4 of 5
2.4.24.4
Glass
Transition
and
Modulus
of
Materials
Used
in
High
Density
Interconnection
(HDI)
and
Microvias
-
DMA
Method
11/98
and
measurement
start
and
end
points
and
computer
gener¬
ated
lines
(see
Figure
1).
5.6.2
Optionally
plot
the
storage
modulus,
loss
modulus,
and
tan
3
vs.
temperature
(
℃)
for
the
specimen
(see
Figure
4).
6
Notes
6.1
Calibration
of
the
DMA
must
be
carried
out
according
to
the
manufacturer's
instructions
for
the
relevant
sample
geom¬
etry
and
thermocouple
temperature.
6.2
There
are
several
methods
for
determining
the
Tg
of
organic
materials:
•
Differential
scanning
calorimetry
(DSC)
•TMA
•
DMA
Tg
in
organic
materials
is
a
broad
transition,
which
arises
when
molecular
mobility
greatly
increases
in
the
specimen
as
a
result
of
heating.
No
one
method
is
superior
to
another;
they
each
measure
different
physical
changes
that
occur
in
a
specimen
near
and
around
Tg.
IPC-24244-4
IPC-TM-650
Number
Subject Date
Revision
Page 5 of 5
2.4.24.4
Glass
Transition
and
Modulus
of
Materials
Used
in
High
Density
Interconnection
(HDI)
and
Microvias
-
DMA
Method
11/98
DSC
measures
the
heat
capacity
of
a
specimen,
TMA
mea¬
sures
the
expansion
of
a
specimen,
and
DMA
measures
the
stiffness
of
the
specimen.
The
Tg
determined
from
TMA,
DSC,
and
DMA
may
vary
significantly
(up
to
20℃)
because
they
are
measuring
different
physical
properties,
which
change
differ¬
ently
as
the
specimen
goes
through
Tg.
As
a
result,
the
test
equipment
used
should
be
noted
after
the
reported
Tg
value
(i.e.,
136℃;
DSC,
TMA,
or
DMA).
6.3
Most
thermal
analysis
equipment
have
the
software
capability
to
determine
sample
Tg
and
modulus
values;
it
is
recommended
that
this
approach
be
used
for
consistency.
6.4
Load
Selection
Criteria
The
initial
load
should
be
5
g
of
tension
(approximately
50
mN).
The
load
(or
force)
may
be
adjusted
for
differences
in
material
types
or
specimen
configu¬
ration
in
order
to
assure
the
specimen
is
being
held
without
slack.
Avoid
an
excessive
load
(or
force),
which
may
result
in
elongation
of
the
specimen
due
to
the
applied
tension.
Speci¬
mens
above
Tg
may
become
so
soft
as
to
be
stretched.
Examine
all
specimens
after
the
test
to
look
for
signs
of
exces¬
sive
loads,
distortions,
tears,
and
other
defects.
6.5
Thermal
Stresses
and
Other
Anomalies
DMA
results
may
be
affected
by
any
stresses
that
might
have
been
frozen
into
the
sample
during
processing.
Samples
showing
anoma¬
lous
behavior
should
be
run
a
second
time
or
preconditioned
to
remove
such
stresses.
Holding
the
sample
temperature
at
20℃
above
the
glass
transition
and
holding
for
five
minutes,
followed
by
slow
cooling,
will
normally
remove
the
stresses
in
the
sample.
6.6
Understanding
DMA
Refer
to
ASTM
D-4092
for
a
bet¬
ter
understanding
of
concepts
and
definitions
of
terms
for
dynamic
mechanical
measurements.
6.7
Instrument
Suppliers
DMA
instruments
capable
of
meeting
the
requirements
of
this
test
method
are
known
to
be
available
from:
TA
Instruments
Perkin
Elmer
Corp.
Seiko
Instruments,
Inc.
Rheometrics
Scientific
Netzsch
Instruments,
Inc.