IPC-TM-650 EN 2022 试验方法--.pdf - 第373页
ASTM D 3386 Figure 1 T e m p e r a t u r e ( C ) A 0 B 2 0 0 Ex t e n s i o n The Institute for Int erconnecting and Packaging E lectronic Circuits 2215 S anders Road • Northbrook, IL 60062-6135 Material in this T est M …
Example:
Note:
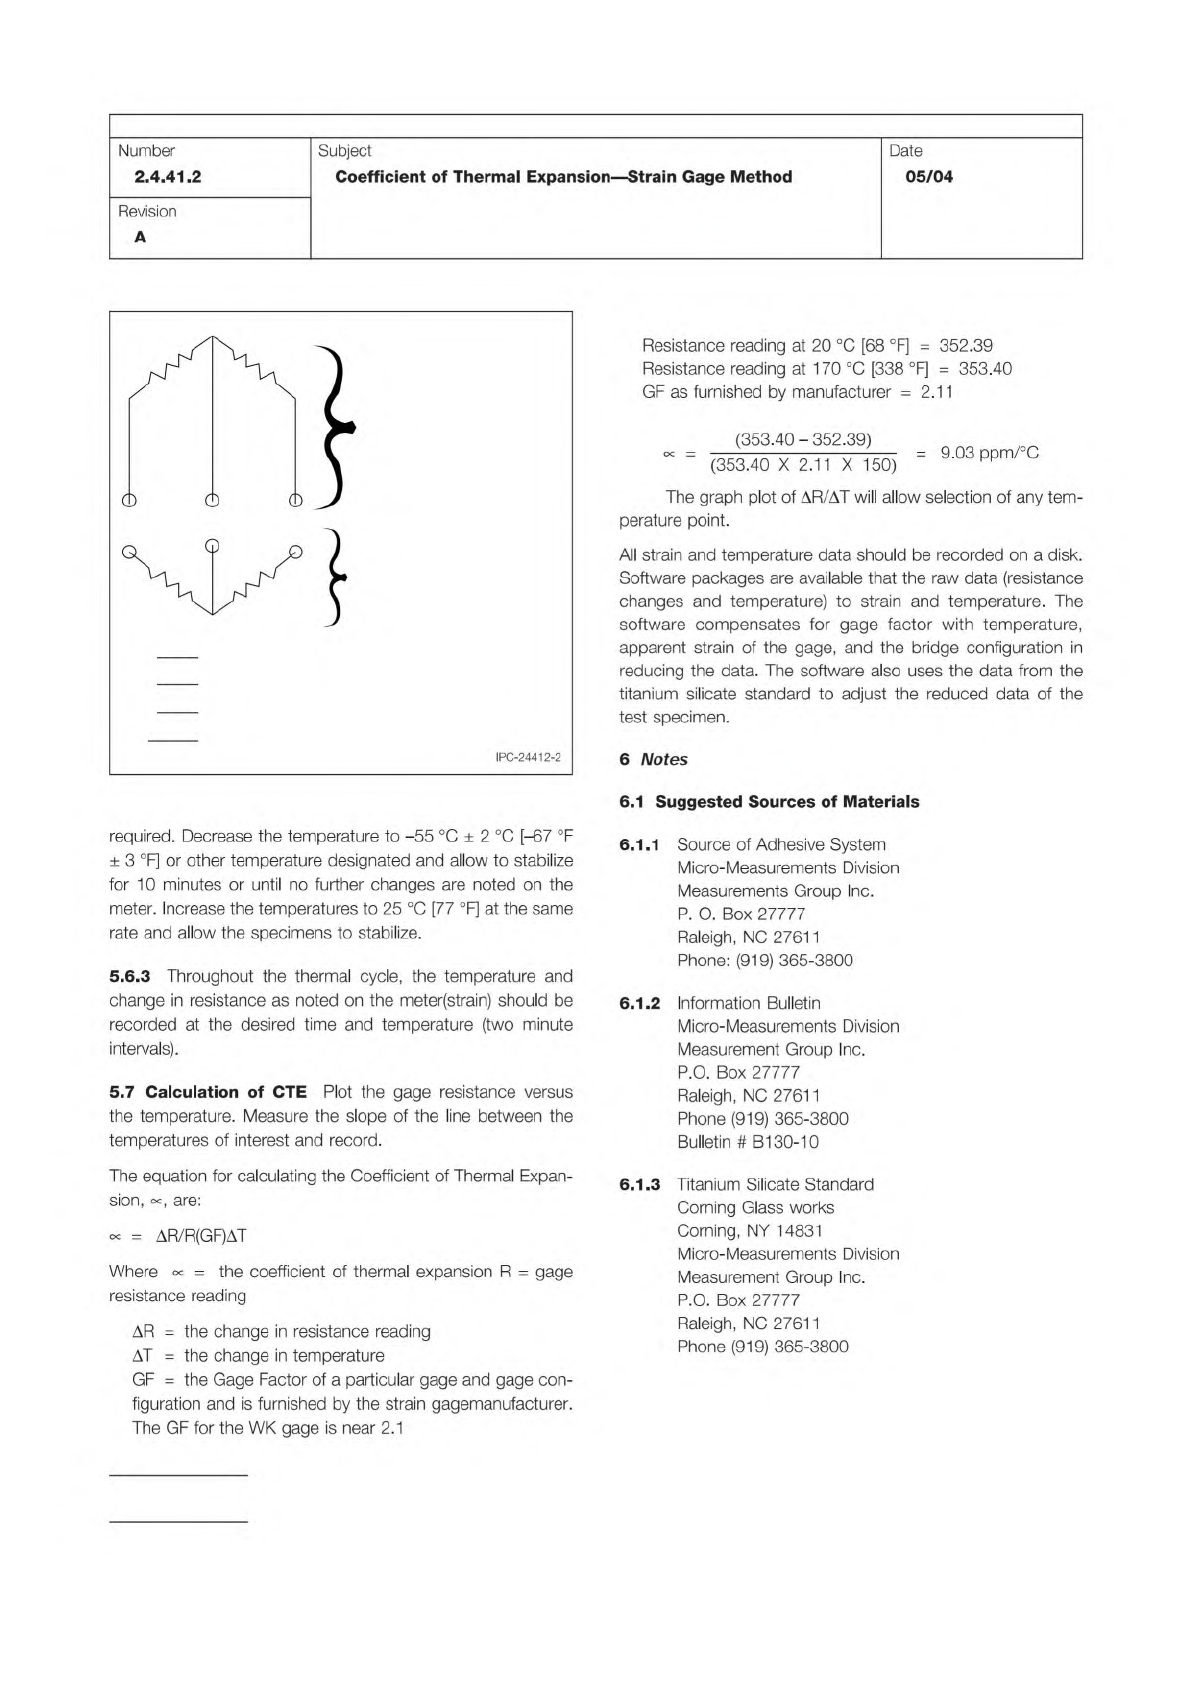
Figure 2 Wheatstone Bridge Instrumentation Hookup
R Gage on Unknown
R Gage on Standard
R Standard Resistors on Instrument
M Direct Reading Strain Meter
External or Measurement
Half Bridge
Internal or Instrument
Half Bridge
U
S
K
R
U
R
S
R
K
R
K
M
IPC-TM-650
Page 4 of 4
Number
2.4.41.2
Revision
A
Subject
Coefficient
of
Thermal
Expansion
—
Strain
Gage
Method
Date
05/04
required.
Decrease
the
temperature
to
-55
±
2
[-67
°F
±
3
°F]
or
other
temperature
designated
and
allow
to
stabilize
for
10
minutes
or
until
no
further
changes
are
noted
on
the
meter.
Increase
the
temperatures
to
25
[77
°F]
at
the
same
rate
and
allow
the
specimens
to
stabilize.
5.6.3
Throughout
the
thermal
cycle,
the
temperature
and
change
in
resistance
as
noted
on
the
meter(strain)
should
be
recorded
at
the
desired
time
and
temperature
(two
minute
intervals).
5.7
Calculation
of
CTE
Plot
the
gage
resistance
versus
the
temperature.
Measure
the
slope
of
the
line
between
the
temperatures
of
interest
and
record.
The
equation
for
calculating
the
Coefficient
of
Thermal
Expan¬
sion,
8,
are:
8
二
AR/R(GF)AT
Where
8
二
the
coefficient
of
thermal
expansion
R
=
gage
resistance
reading
AR
二
the
change
in
resistance
reading
AT
二
the
change
in
temperature
GF
=
the
Gage
Factor
of
a
particular
gage
and
gage
con¬
figuration
and
is
furnished
by
the
strain
gagemanufacturer.
The
GF
for
the
WK
gage
is
near
2.1
Resistance
reading
at
20
[68
°F]
=
352.39
Resistance
reading
at
1
70
[338
°F]
=
353.40
GF
as
furnished
by
manufacturer
=
2.11
(353.40-352.39)
(353.40
X
2.11
X
150)
二
9.03
ppm/℃
The
graph
plot
of
AR/AT
will
allow
selection
of
any
tem¬
perature
point.
All
strain
and
temperature
data
should
be
recorded
on
a
disk.
Software
packages
are
available
that
the
raw
data
(resistance
changes
and
temperature)
to
strain
and
temperature.
The
software
compensates
for
gage
factor
with
temperature,
apparent
strain
of
the
gage,
and
the
bridge
configuration
in
reducing
the
data.
The
software
also
uses
the
data
from
the
titanium
silicate
standard
to
adjust
the
reduced
data
of
the
test
specimen.
6
Notes
6.1
Suggested
Sources
of
Materials
6.1.1
Source
of
Adhesive
System
M
icro-
Measurements
Division
Measurements
Group
Inc.
P.
O.
Box
27777
Raleigh,
NG
27611
Phone:
(919)
365-3800
6.1.2
Information
Bulletin
Micro-Measurements
Division
Measurement
Group
Inc.
P.O.
Box
27777
Raleigh,
NO
27611
Phone
(919)
365-3800
Bulletin
#
B1
30-10
6.1.3
Titanium
Silicate
Standard
Corning
Glass
works
Corning,
NY
14831
Micro-
Measurements
Division
Measurement
Group
Inc.
P.O.
Box
27777
Raleigh,
NG
27611
Phone
(919)
365-3800
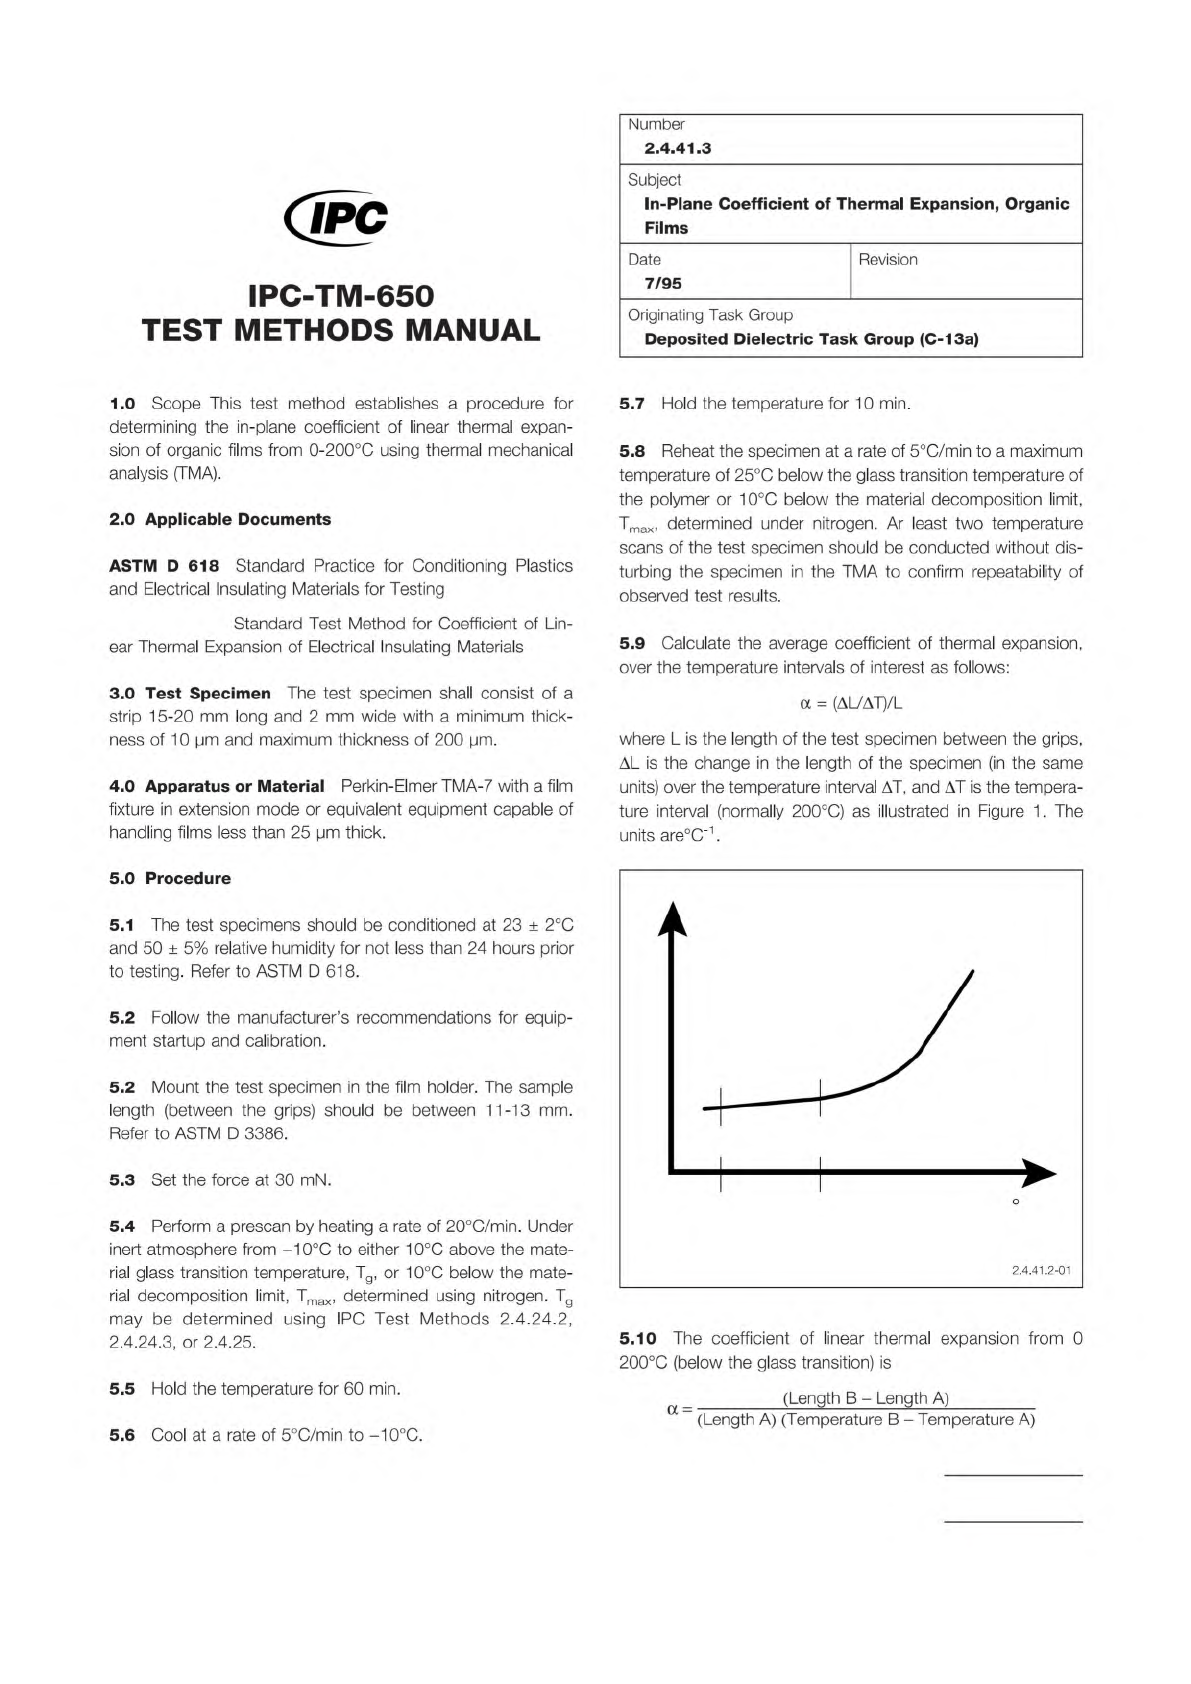
ASTM D 3386
Figure 1
T
emperature (
C)
A
0
B
200
Extension
The Institute for Interconnecting and Packaging Electronic Circuits
2215 Sanders Road • Northbrook, IL 60062-6135
Material in this Test Methods Manual was voluntarily established by Technical Committees of the IPC. This material is advisory only
and its use or adaptation is entirely voluntary. IPC disclaims all liability of any kind as to the use, application, or adaptation of this
material. Users are also wholly responsible for protecting themselves against all claims or liabilities for patent infringement.
Equipment referenced is for the convenience of the user and does not imply endorsement by the IPC.
Page 1 of 2
IPC-TM-650
TEST
METHODS
MANUAL
1
.0
Scope
This
test
method
establishes
a
procedure
for
determining
the
in-plane
coefficient
of
linear
thermal
expan¬
sion
of
organic
films
from
0-200℃
using
thermal
mechanical
analysis
(TMA).
2
.0
Applicable
Documents
ASTM
D
618
Standard
Practice
for
Conditioning
Plastics
and
Electrical
Insulating
Materials
for
Testing
Standard
Test
Method
for
Coefficient
of
Lin¬
ear
Thermal
Expansion
of
Electrical
Insulating
Materials
3
.0
Test
Specimen
The
test
specimen
shall
consist
of
a
strip
15-20
mm
long
and
2
mm
wide
with
a
minimum
thick¬
ness
of
1
0
pm
and
maximum
thickness
of
200
pm.
4
.0
Apparatus
or
Material
Perkin-Elmer
TMA-7
with
a
film
fixture
in
extension
mode
or
equivalent
equipment
capable
of
handling
films
less
than
25
pm
thick.
5
.0
Procedure
5.1
The
test
specimens
should
be
conditioned
at
23
土
2
℃
and
50
±
5%
relative
humidity
for
not
less
than
24
hours
prior
to
testing.
Refer
to
ASTM
D
618.
5.2
Follow
the
manufacturer's
recommendations
for
equip¬
ment
startup
and
calibration.
5.2
Mount
the
test
specimen
in
the
film
holder.
The
sample
length
(between
the
grips)
should
be
between
11-13
mm.
Refer
to
ASTM
D
3386.
5.3
Set
the
force
at
30
mN.
5.4
Perform
a
prescan
by
heating
a
rate
of
20℃/min.
Under
inert
atmosphere
from
-10℃
to
either
10℃
above
the
mate¬
rial
glass
transition
temperature,
Tg,
or
10℃
below
the
mate¬
rial
decomposition
limit,
Tmax,
determined
using
nitrogen.
Tg
may
be
determined
using
IPC
Test
Methods
2.4.24.2,
2.4.24.3,
or
2.4.25.
5.5
Hold
the
temperature
for
60
min.
Number
2.4.41.3
Subject
In-Plane
Coefficient
of
Thermal
Expansion,
Organic
Films
Date
Revision
7/95
Originating
Task
Group
Deposited
Dielectric
Task
Group
(C-13a)
5.7
Hold
the
temperature
for
10
min.
5.8
Reheat
the
specimen
at
a
rate
of
5
℃/min
to
a
maximum
temperature
of
25℃
below
the
glass
transition
temperature
of
the
polymer
or
10℃
below
the
material
decomposition
limit,
Tmax,
determined
under
nitrogen.
Ar
least
two
temperature
scans
of
the
test
specimen
should
be
conducted
without
dis¬
turbing
the
specimen
in
the
TMA
to
confirm
repeatability
of
observed
test
results.
5.9
Calculate
the
average
coefficient
of
thermal
expansion,
over
the
temperature
intervals
of
interest
as
follows:
a
二
(AUAT)/L
where
L
is
the
length
of
the
test
specimen
between
the
grips,
AL
is
the
change
in
the
length
of
the
specimen
(in
the
same
units)
over
the
temperature
interval
AT,
and
AT
is
the
tempera¬
ture
interval
(normally
200℃)
as
illustrated
in
Figure
1.
The
units
are℃-1
.
5.10
The
coefficient
of
linear
thermal
expansion
from
0
200℃
(below
the
glass
transition)
is
(Length
B
-
Length
A)
-
(Length
A)
(Temperature
B
-
Temperature
A)
5.6
Cool
at
a
rate
of
5
℃/min
to
-10℃.
IPC-TM-650
Number
Subject Date
Revision
Page 2 of 2
2.4.41.3
In-Plane
Coefficient
of
Thermal
Expansion,
Organic
Films
7/95
5.11
On
some
instruments
AL
and
AT
may
be
read
directly
from
the
recorder
chart.
On
other
instruments,
constant
fac¬
tors
(from
the
instrument
calibration
-
see
section
6.3)
may
need
to
be
applied
to
the
chart
readings
to
obtain
these
val¬
ues.
6.0
Notes
6.1
Calibration
of
the
instrument
must
be
carried
out
according
to
the
manufacturer's
recommendations.
Two
cali¬
brations
are
required,
one
to
establish
the
baseline
and
the
other
to
calibrate
the
TMA
relative
to
a
standard.
6.2
A
quartz
specimen
of
11-13
mm
in
length
(between
the
grips)
is
run
at
5
℃/min
under
inert
gas
purge
(He)
from
-20
to
400℃
to
establish
a
baseline.
The
baseline
is
used
to
elimi¬
nate
the
effects
of
grip
expansion
on
extension
measure¬
ments.
The
coefficient
of
average
thermal
expansion
of
quartz
is
0.57
x
1
0-6/℃
(16-500℃)1.
This
baseline
procedure
should
be
used
to
either
correct
the
instrument
performance
to
obtain
the
literature
stated
value
of
linear
thermal
expansion
quartz,
or,
in
the
event
the
instrument
cannot
be
adjusted
to
obtain
this
value,
obtain
an
estimated
correction
factor
which
is
then
applied
to
results
from
test
specimens.
6.3
Using
a
calibration
standard
with
dimensions
equivalent
to
the
test
specimen,
a
calibration
standard
is
run
between
-10
and
200
and
the
observed
coefficient
of
thermal
expansion
is
calculated
using
the
expression:
a°b
=
(AUAT)/L
where
L
is
the
length
of
the
test
specimen
between
the
grips.
AL
is
the
change
in
the
length
of
the
specimen
(in
the
same
units)
over
the
temperature
interval
AT,
and
AT
is
nominally
200
℃
.
The
units
of
aobare
℃
-1.
An
estimated
test
specimen
correction
factor,
C,
is
then
determined
by
dividing
aob
by
the
literature
value,
必什,
for
the
standard(s).
The
estimated
test
specimen
correction
factor
is
then
as
a
multiplcation
factor
and
applied
to
the
observed
linear
thermal
expansion
results
for
the
test
specimens.
6.4
The
maximum
temperature
used
in
this
test
should
be
at
least
25℃
below
the
glass
transition
temperature
of
the
mate¬
rial
being
studied.
Heating
above
the
glass
transition
may
alter
the
morphology
of
the
specimen
(e.g.,
change
the
molecular
orientation)
leading
to
erroneous
results.
For
materials
with
glass
transitions
below
250℃,
the
temperature
range
over
which
the
coefficient
of
linear
thermal
expansion
was
deter¬
mined
must
be
noted,
e.g.,
50
x
1
0-6/℃
(0-1
50℃).
1
.
Lange's
Handbook
of
Chemistry,
12th
edition,
J.
A.
Dean,
ed.,
McGraw-Hill,
New
York
(1979).