IPC-TM-650 EN 2022 试验方法--.pdf - 第380页
Figure 1 Solder ball test standards Preferred Acceptable Unacceptable; Clusters Un acceptable IPC-TM-650 Number Subject Date Revision Page 3 of 3 2.4.43 Solder Paste ― Solder Ball Test 1/95
IPC-TM-650
Number
Subject Date
Revision
Page 2 of 3
2.4.43
Solder
Paste
―
Solder
Ball
Test
1/95
5.2.3.2
Place
the
substrate
on
the
hot
plate.
As
soon
as
the
solder
has
melted,
withdraw
the
substrate
from
the
hot
plate
maintaining
a
horizontal
position.
The
reflow
shall
occur
within
20
seconds
after
the
specimen
is
placed
in
contact
with
the
hot
plate.
5.3
Evaluation
5.3.1
Examine
the
reflowed
specimens
under
10X
to
20X
magnification.
5.3.2
Solder
ball
size
and
number
should
be
compared
with
Figure
1
.
5.3.3
Record
the
degree
of
reflow
in
comparison
with
Figure
1
for
the
6.5
cm
and
1
.5
cm
acceptance/reject
conditions,
respectively.
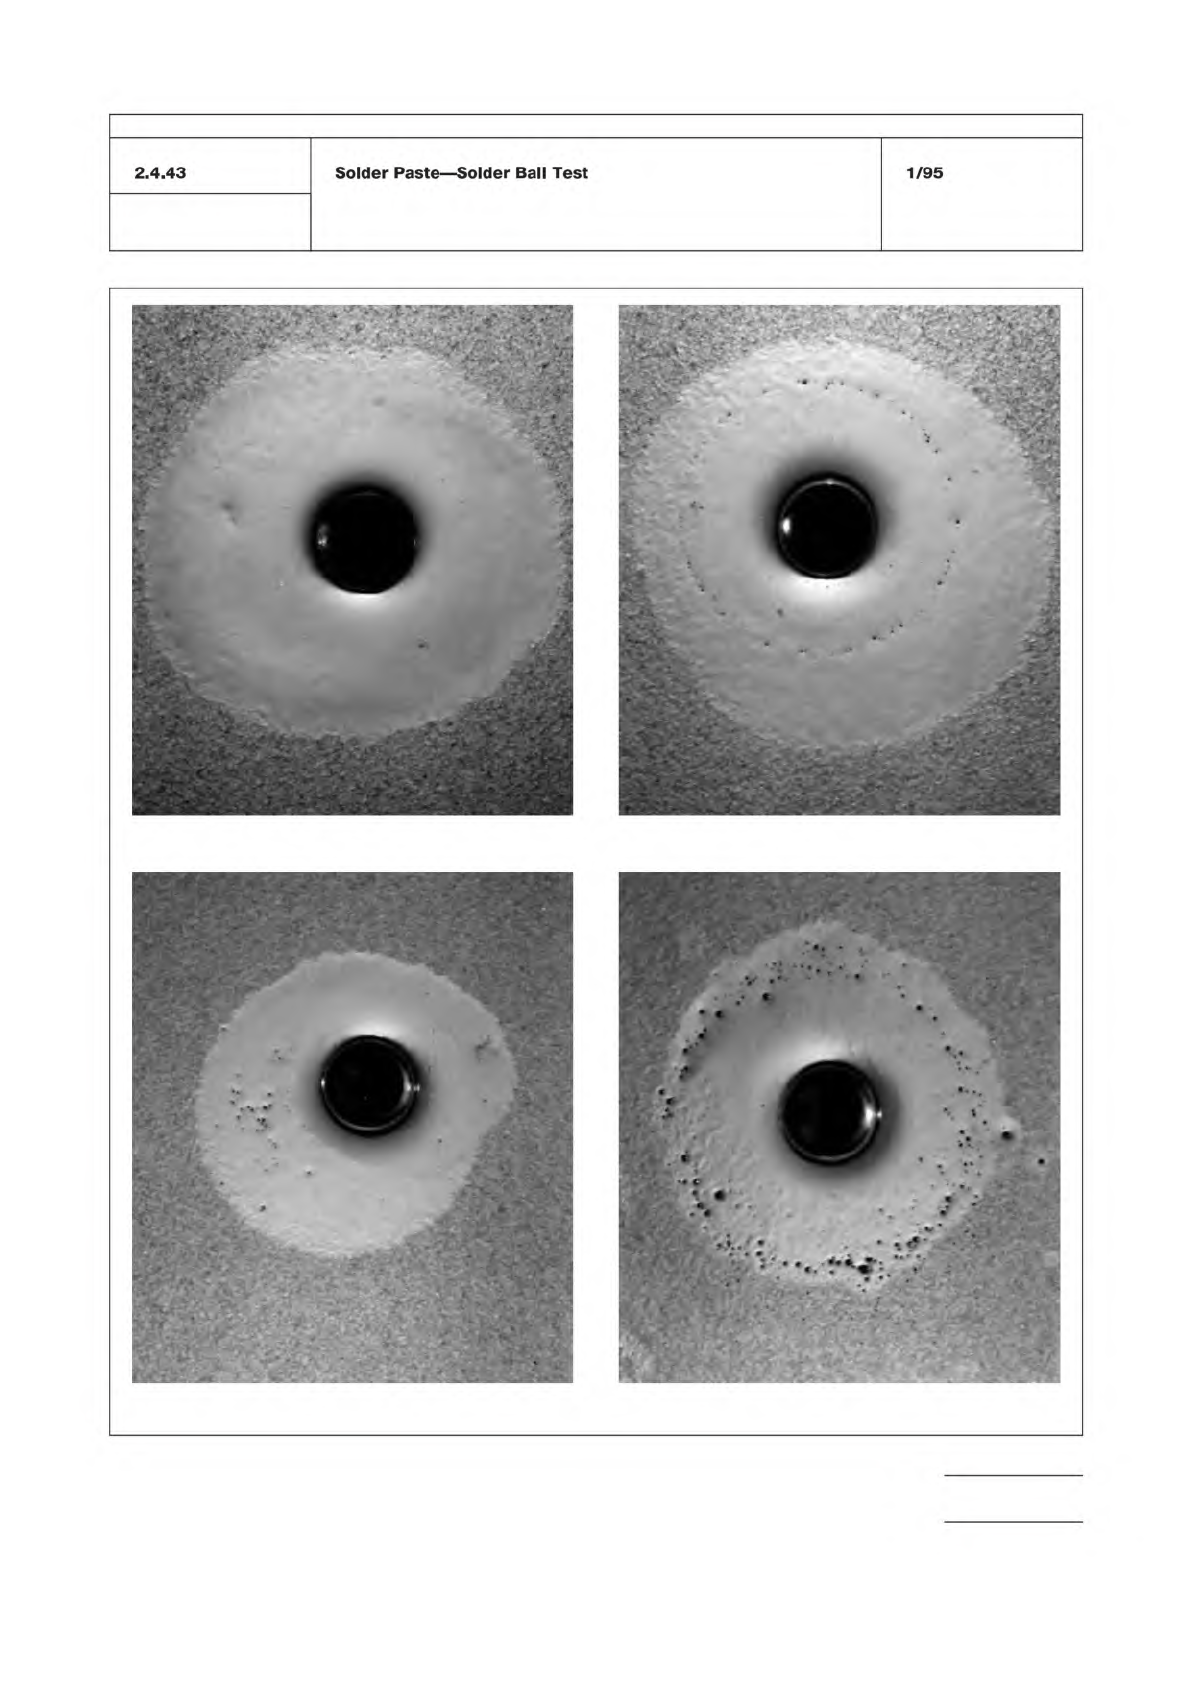
Figure 1 Solder ball test standards
Preferred Acceptable
Unacceptable; Clusters Unacceptable
IPC-TM-650
Number
Subject Date
Revision
Page 3 of 3
2.4.43
Solder
Paste
―
Solder
Ball
Test
1/95
The Institute for Interconnecting and Packaging Electronic Circuits
2215 Sanders Road • Northbrook, IL 60062-6135
Material in this Test Methods Manual was voluntarily established by Technical Committees of the IPC. This material is advisory only
and its use or adaptation is entirely voluntary. IPC disclaims all liability of any kind as to the use, application, or adaptation of this
material. Users are also wholly responsible for protecting themselves against all claims or liabilities for patent infringement.
Equipment referenced is for the convenience of the user and does not imply endorsement by the IPC.
Page 1 of 1
IPC-TM-650
TEST
METHODS
MANUAL
1
.0
Scope
This
test
is
to
determine
the
ability
of
a
printed
pattern
of
solder
paste
to
retain
a
probe
placed
in
the
solder
paste
by
measuring
the
force
required
to
separate
the
probe
from
the
paste.
Time
between
printing
and
probe
placement
are
progressively
increased
to
simulate
variables
in
a
manu¬
facturing
process.
2
.0
Applicable
Documents
None
3
.0
Test
Specimen
A
representative
sample
of
this
paste
should
then
be
printed
out,
using
a
stencil,
onto
clean
plain¬
glass
slides.
At
least
six
paste
deposits
should
be
printed
per
required
time
data-point.
The
final
deposits
must
be
circular,
6.3
mm
in
diameter
and
0.25
mm
thick.
Mark
the
test
speci¬
men
in
a
suitable
manner
to
identify
the
sample
and
the
time
after
printing
when
tackiness
is
to
be
measured.
The
prepared
samples
shall
be
stored
at
25℃
±
2
℃
and
50℃
土
1
0%
rela¬
tive
humidity
(RH)
until
evaluated.
The
samples
shall
not
be
stored
in
an
enclosed
cabinet
or
container,
which
allows
the
solder
paste
solvent
vapors
to
saturate
the
environment
sur¬
rounding
the
printed
paste,
thus
preventing
natural
drying
of
the
material.
4
.0
Equipment/Apparatus
A
Chatillon
tackiness
tester
or
other
equipment
may
be
used,
providing
it
is
capable
of
accu¬
rately
measuring
force
when
tested
at
a
similar
velocity.
The
equipment
shall
have
a
stainless
steel
test
probe
with
a
nomi¬
nal
5.1
mm
±
0.13
mm
diameter
bottom
surface,
which
is
smooth,
flat,
and
aligned
parallel
to
the
plane
of
the
subject
test
specimen.
The
probe
shall
contact
the
test
specimen
at
a
controlled
speed
and
apply
a
controlled,
fixed
initial
contact
force.
Finally,
a
means
shall
be
provided
to
withdraw
the
test
probe
from
the
surface
of
the
test
specimen
at
a
controlled
speed
and
record
the
peak
force
required
to
break
contact
with
the
test
specimen.
5
.0
Procedure
Place
the
specimen
slide
under
the
test
probe
and
center
the
probe
over
one
of
the
three
printed
pat¬
terns.
Bring
the
test
probe
in
contact
with
the
printed
paste
specimen
at
a
rate
of
2.5
mm/min.
土
0.5
mm/min.
and
apply
a
force
of
300
g
±
30
g
to
the
specimen.
Within
five
seconds
Number
2.4.44
Subject
Solder
Paste
—
Tack
Test
Date
Revision
3/98
Reaffirmed
Originating
Task
Group
Solder
Paste
Task
Group
(5-24b)
following
application
of
this
force,
withdraw
the
probe
from
the
specimen
at
a
rate
of
2.5
mm/min.
±
0.5
mm/min.
and
record
the
peak
force
required
to
break
the
contact.
Take
at
least
five
additional
measurements
under
the
same
test
conditions
and
average
all
the
readings.
Record
both
the
tack
force
and
time
following
paste
printing.
5.1
Evaluation
Initial
measurements
are
to
be
taken
imme¬
diately
after
printing.
Subsequent
measurements
of
force
shall
be
taken
as
needed
to
best
define
the
rise
and
decline
of
the
tack
force.
Tackiness
data
should
be
presented
in
graph
form,
provided
that
the
graph
with
tack
force
is
plotted
as
a
func¬
tion
of
time
after
printing.
The
data
can
also
be
reported
as
follows:
1.
Time
to
reach
80%
of
the
peak
value.
2.
The
peak
tack
force
in
grams
with
the
expected
variation.
3.
Time
over
which
the
peak
value
is
maintained
or
for
the
tack
force
to
decline
to
80%
of
its
peak
value.
6.0
Notes
6.1
Test
Equipment
Sources
The
equipment
sources
described
in
6.1.1
and
6.1.2
represent
those
currently
known
to
the
industry.
Users
of
this
test
method
are
urged
to
submit
additional
source
names
as
they
become
available
so
that
this
list
can
be
kept
as
current
as
possible.
6.1.1
AMETEK/Chatillon
8600
Somerset
Drive
Largo,
FL
33773
Phone:
1
(800)
527-9999
6.1.2
Malcom
Instruments
Corp.
26226
Industrial
Blvd.
Hayward,
GA
94545
Phone:
1
(510)
293-0580