IPC-TM-650 EN 2022 试验方法--.pdf - 第399页
curve, d etermine u i (P). The corrected displacement is then calculated using u c (P) = u Q (P) - u i (P). 7.2.2 In p ractice, it is common to obtain a linear displace- ment correction cu rve (up to the fracture loads o…

Tabulated values of ƒ(x) are given in Table 7-1.
7.1.5
For the bend specimens calculate G
Q
[=] kJ/m2 from
the corrected energy, U, as follows:
G
Q
= U/(BWΦ ) or G
Q
= η
e
U/(B(W - a))
Values of η
e
are given in Table 7-1. The energy calibration
factor, Φ, is defined as:
Φ = C/(dC/d(A/W))
and
be computed from the following:
Φ = (A + 18.64)/(dA/dx)
where:
A = [16x
2
/(1 - x)
2
][8.9 - 33.717x + 79.616x
2
- 112.952x
3
+
84.815x
4
- 25.672x
5
],
and:
dA/dx = [16x
2
/(1 - x)
2
][-33.717 + 159.232x - 338.856x
2
+
339.26x
3
- 128.36x
4
]
+ 16[8.9 - 33.717x + 79.616x
2
-112.952x
3
+ 84.815x
4
-
25.672x
5
]{[2x(1 - x) + 2x
2
]/(1 - x)
3
}
Values of Φ are given in Table 7-1.
7.1.6
(Reference ASTM D5045, Section 9.1.3) Check the
validity of K
Q
via the size criteria. Calculate 2.5 (K
Q
/σ
y
)
2
where
σ
y
is the yield stress. If this quantity is less than the specimen
thickness, B, the crack length, a, and the ligament (W - a),
then K
Q
is equal to K
1c
. Otherwise the test is not a valid K
1c
test.
Use of a specimen with too small a thickness, B, will
result in K
Q
being higher than the true K
1c
value while a small
(W - a) will result in a K
Q
value that is lower than the true K
1c
value. The net effect may be close to the correct K
1c
but
unfortunately in an unpredictable way, since the dependence
on B cannot be quantified.
7.1.7
For the recommended specimen dimensions of W =
2B and a/W = 0.5, all the relationships of 7.1.6 are satisfied
simultaneously. In fact, the criterion covers two limitations in
that B must be sufficient to ensure plane strain, but (W - a) has
to be sufficient to avoid excessive plasticity in the ligament. If
(W - a) is too small the test will often violate the linearity crite-
ria. If the linearity criterion is violated, a possible option is to
increase W for the same a/W and S/W ratios. Values of W/B
of up to 4 are permitted.
7.1.8
If the test result fails to meet the requirements in either
7.1.2 or 7.1.6, or both, it will be necessary to use a larger
specimen to determine K
Q
. The dimensions of the larger
specimen can be estimated on the basis of K
Q
, but generally
must be increased to 1.5 times those of the specimen that
failed to produce a valid K
1c
value.
7.2 Displacement Correction for Calculation of G
Q
(Ref-
erence ASTM D5045, Section 9.2)
Make a displacement correction for system compliance,
loading-pin penetration, and specimen compression, then cal-
culate G
1C
from the energy derived from integration of the
load versus load-point displacement curve.
7.2.1
The procedure for obtaining the corrected displace-
ment, u
c
(P), at load P from the measured displacement, u
Q
(P), is as follows: Use an un-cracked displacement correction
specimen prepared from the same material as that being
tested. Using the same testing parameters as the actual test,
load the specimen to a point at or above the fracture loads
observed during actual testing. From the load-displacement
Φ ψ η
0.450 9.14 0.274 45.8 2.00
0.455 9.27 0.272 46.7 2.00
0.460 9.41 0.269 47.6 2.01
0.465 9.55 0.266 48.5 2.01
0.470 9.70 0.263 49.5 2.02
0.475 9.85 0.260 50.4 2.02
0.480 10.00 0.257 51.4 2.03
0.485 10.16 0.254 52.5 2.03
0.490 10.32 0.252 53.5 2.03
0.495 10.48 0.249 54.7 2.03
0.500 10.65 0.246 55.8 2.03
0.505 10.82 0.243 57.0 2.03
0.510 10.99 0.241 58.2 2.04
0.515 11.17 0.238 59.4 2.04
0.520 11.36 0.236 60.7 2.04
0.525 11.54 0.233 62.1 2.04
0.530 11.74 0.230 63.5 2.04
0.535 11.94 0.228 64.9 2.04
0.540 12.14 0.225 66.4 2.04
0.545 12.35 0.223 67.9 2.04
0.550 12.56 0.220 69.5 2.05
Values calculated using A. Bakker, Compatibility Compliance and Stress
Intensity Expressions for the Standard Three-Point Bend Specimens. Paper
submitted for publication in International Journal of Fatigue and Fracture of
Engineering Materials and Structures (March 1989).
Number
2.4.52
Subject
Fracture Toughness of Resin Systems for Base Materials
Date
07/13
Revision
Page 5 of 8
IPC-TM-650
—
Table
7-1
Calibration
Factors
SENB"
S/W
=
4
a/W
fM
e
NOTE:
shall
curve, determine ui (P). The corrected displacement is then
calculated using u
c
(P) = u
Q
(P) - u
i
(P).
7.2.2
In practice, it is common to obtain a linear displace-
ment correction curve (up to the fracture loads observed dur-
ing actual testing). This simplifies the displacement correction
to be applied to the fracture test. Initial non-linearity due to
penetration of the loading pins into the applied specimen
should occur during both the calibration test and the actual
fracture test. Linearization of the near-zero correction data
and the fracture test data can compensate for this initial non-
linearity.
7.2.3
The displacement correction must be performed for
each material and at each test temperature or rate. Polymers
are generally temperature- and rate-sensitive and the degree
of loading-pin penetration and sample compression can vary
with changes in these variables.
7.2.4
The indentation tests should be performed in such a
way that the loading times are the same as the fracture tests.
Since the indentations are stiffer, this will involve lower rates to
reach the same loads.
7.3 Calculation of G
Q
(Reference ASTM D5045, Section
9.3)
In principle, G
1C
can be obtained from the following:
G
1C
= (1 - v
2
) K
1C
2
/ E [Ref. 2]
but for plastics, E must be obtained at the same time and
temperature conditions as the fracture test because of vis-
coelastic effects. Many uncertainties are introduced by this
procedure and it is considered preferable to determine G
1C
directly from the energy derived from integration of the load
versus displacement curve up to the same load point as used
for K
1C
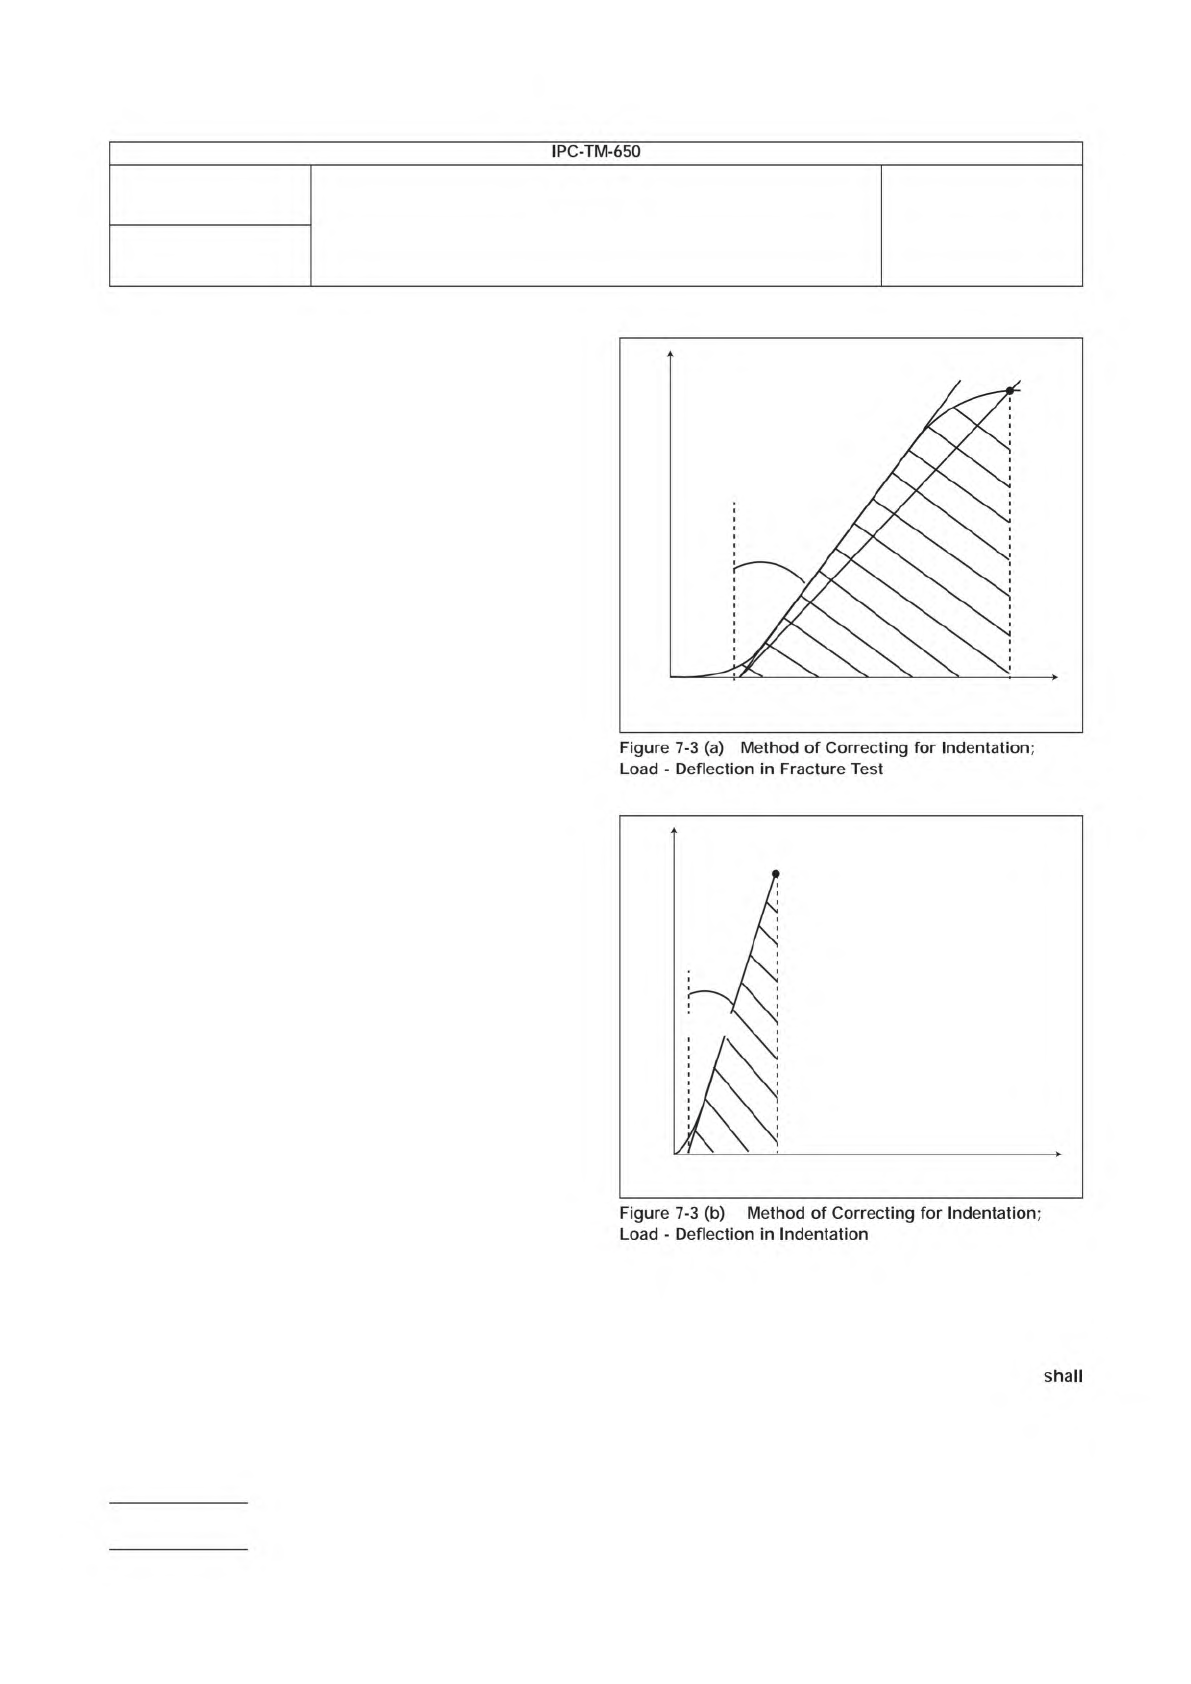
and shown in Figures 7-3 (a and b).
7.3.1
The energy must be corrected for system compliance,
loading-pin penetration, and specimen compression. This is
done by correcting the measured displacement values, as
shown in Figure 7-3 (a and b). Accordingly, if complete linear-
ity is obtained, one form of the integration for energy is as U =
1/2 P
Q
(u
Q
- u
i
), where P
Q
is defined in 7.1.2.
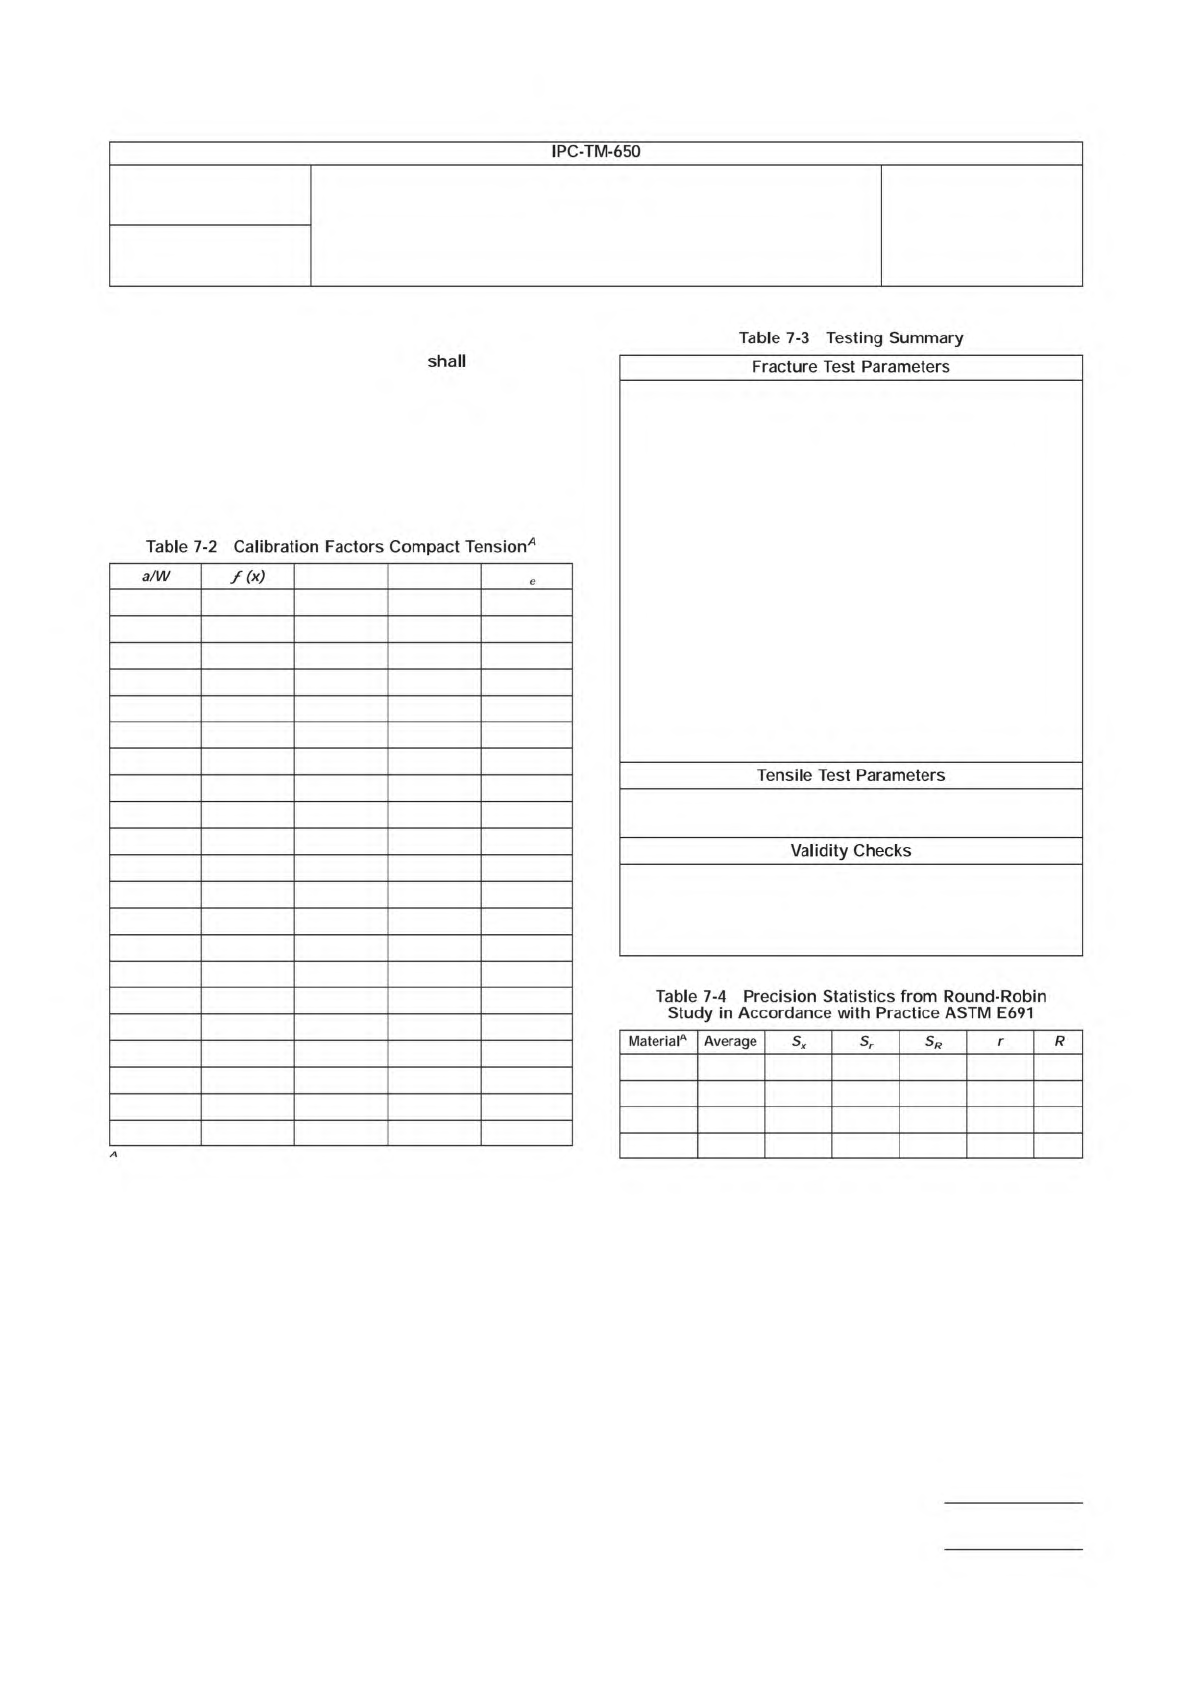
7.3.2
Alternatively, it is possible to use the integrated areas
from the measured curve, U
Q
, of Figure 7-3, a and indenta-
tion curves, U
i
, of Figure 7-3, b in accordance with 7.3.3 and
following.
U = U
Q
- U
i
[Ref.3, SENB].
7.3.3
Calculate G
Q
from U in accordance with the proce-
dure given in 7.1.5.
7.3.4
A useful cross check on accuracy may be made using
the tensile modulus, E, and Poisson’s ratio, v. E/(1 - v
2
)
be calculated from the corrected compliance, C
c
, using the
following:
(E / (1 - v
2
)) B C
c
= 2ƒ
2
Φ = ψ [Ref. 4, SENB]
2-4-52-7-3a.eps
P
U
i
u
u
Q
tan
-1
C
P
Q
or P
max
2-4-52-7-3b.eps
P
u
u
i
U
i
P
Q
or P
max
tan
-1
C
Number
2.4.52
Subject
Fracture Toughness of Resin Systems for Base Materials
Date
07/13
Revision
Page 6 of 8
IPC-TM-650
Figure
7-3
(a)
Method
of
Correcting
for
Indentation;
Load
-
Deflection
in
Fracture
Test
Figure
7-3
(b)
Method
of
Correcting
for
Indentation;
Load
-
Deflection
in
Indentation
shall
The factors f, Φ and ψ are given in Table 7-1 and Table 7-2
for each geometry. This value of E/(1 - v
2
) be compared
with that obtained from K
1c
2 /G
1c
. The former value should
be the larger, but the difference should be <15 %. The cor-
rected compliance, C
c
, is obtained from the measured com-
pliance in the fracture test, C
Q
, and the compliance from the
indentation test, Ci, in accordance with the following:
C
c
= C
Q
- C
i
[Ref. 5, SENB]
Φ ψ η
0.450 8.34 0.208 28.9 2.64
0.455 8.45 0.207 29.6 2.63
0.460 8.57 0.207 30.4 2.61
0.465 8.70 0.206 31.1 2.60
0.470 8.83 0.205 31.9 2.58
0.475 8.96 0.204 32.7 2.57
0.480 9.09 0.203 33.5 2.56
0.485 9.23 0.202 34.4 2.54
0.490 9.36 0.201 35.3 2.53
0.495 9.51 0.200 35.3 2.53
0.500 9.65 0.199 37.1 2.51
0.505 9.81 0.198 38.0 2.50
0.510 9.96 0.197 39.0 2.49
0.515 10.12 0.196 40.0 2.48
0.520 10.28 0.194 41.1 2.47
0.525 10.45 0.193 42.1 2.46
0.530 10.62 0.192 43.3 2.45
0.535 10.80 0.190 44.4 2.44
0.540 10.98 0.189 45.6 2.43
0.545 11.17 0.188 46.8 2.42
0.550 11.36 0.186 48.1 2.41
Values calculated using J. A. Knapp, G. S. Leger and B. Gross, Fracture
Mechanics Sixteenth Symposium, ASTM, STP 868, 19, pp. 27 - 44.
7.4 Report
List the information required to perform the test
and the results obtained in the form of a table. The form to
use is provided in Table 7-3.
7.4.1
Table 7-4 is based on a round robin conducted in
1988 in accordance with E-691, involving four materials
tested by nine laboratories. For each material, all the samples
were prepared at one source, but the individual specimens
were prepared at the laboratories which tested them. Each
test result was the average of three individual determinations.
Each laboratory obtained one test result for each material. The
following explanations of r and R are only intended to present
a meaningful way of considering the approximate precision of
this test method. The data in Table 7-4 should not be rigor-
ously applied to acceptance or rejection of material, as those
data are specific to the round robin and may not be represen-
tative of other lots, conditions, materials, or laboratories.
Testing Laboratory
Materials/orientation
Specimen geometry
Test temperature, °C
Loading rate, m/s
Notching method
Specimen number
Width (W), mm
Crack length from 7.2.2, mm
P
max
, N
P
max
loading rate, s
PQ loading time, s
Stable or unstable growth
K
Q
, MPa - m
1/2
Uncorrected energy, J
Corrected energy, J
G
Ic
, kJ/m
2
σy, MPa
σy loading time, s
Pmax/PQ
2.5 (KQ/sy)
2
E/(1 - ν
2
) via C, MPa
E/(1 - ν
2
) via K
Q
2
/G
c
, MPa
A 4.34 0.652 0.235 0.679 0.658 1.90
B 5.70 1.420 0.618 1.510 1.730 4.23
C 3.60 0.692 0.343 0.747 0.960 2.09
D 5.90 1.950 0.944 2.100 2.640 7.39
A
Material A is values of K
Ic
for nylon. Material B is values of G
Ic
for nylon.
Material C is values of K
Ic
for polycarbonate. Material D is values of G
Ic
for
polycarbonate. Units for all columns are as follows: K
Ic
[=] MP
a
Ë m
1/2
& G
Ic
[=] kJ/m
2
.
Number
2.4.52
Subject
Fracture Toughness of Resin Systems for Base Materials
Date
07/13
Revision
Page 7 of 8
IPC-TM-650
shall
Table
7-2
Calibration
Factors
Compact
Tension*
a/W
/(x)
e
Table
7-3
Testing
Summary
Fracture
Test
Parameters
Tensile
Test
Parameters
Validity
Checks
Table
7-4
Precision
Statistics
from
Round-Robin
Study
in
Accordance
with
Practice
ASTM
E691
Material
Average
Sx
s
「
r
R