IPC-TM-650 EN 2022 试验方法--.pdf - 第40页
Comparisons to Specifications (Used when both specifications exist) T o pic Equation Calculation Answer Comparisons to T otal V ariation T o pic Equation Calculation Answer Measurement T olerance T o pic Equation Calculati…
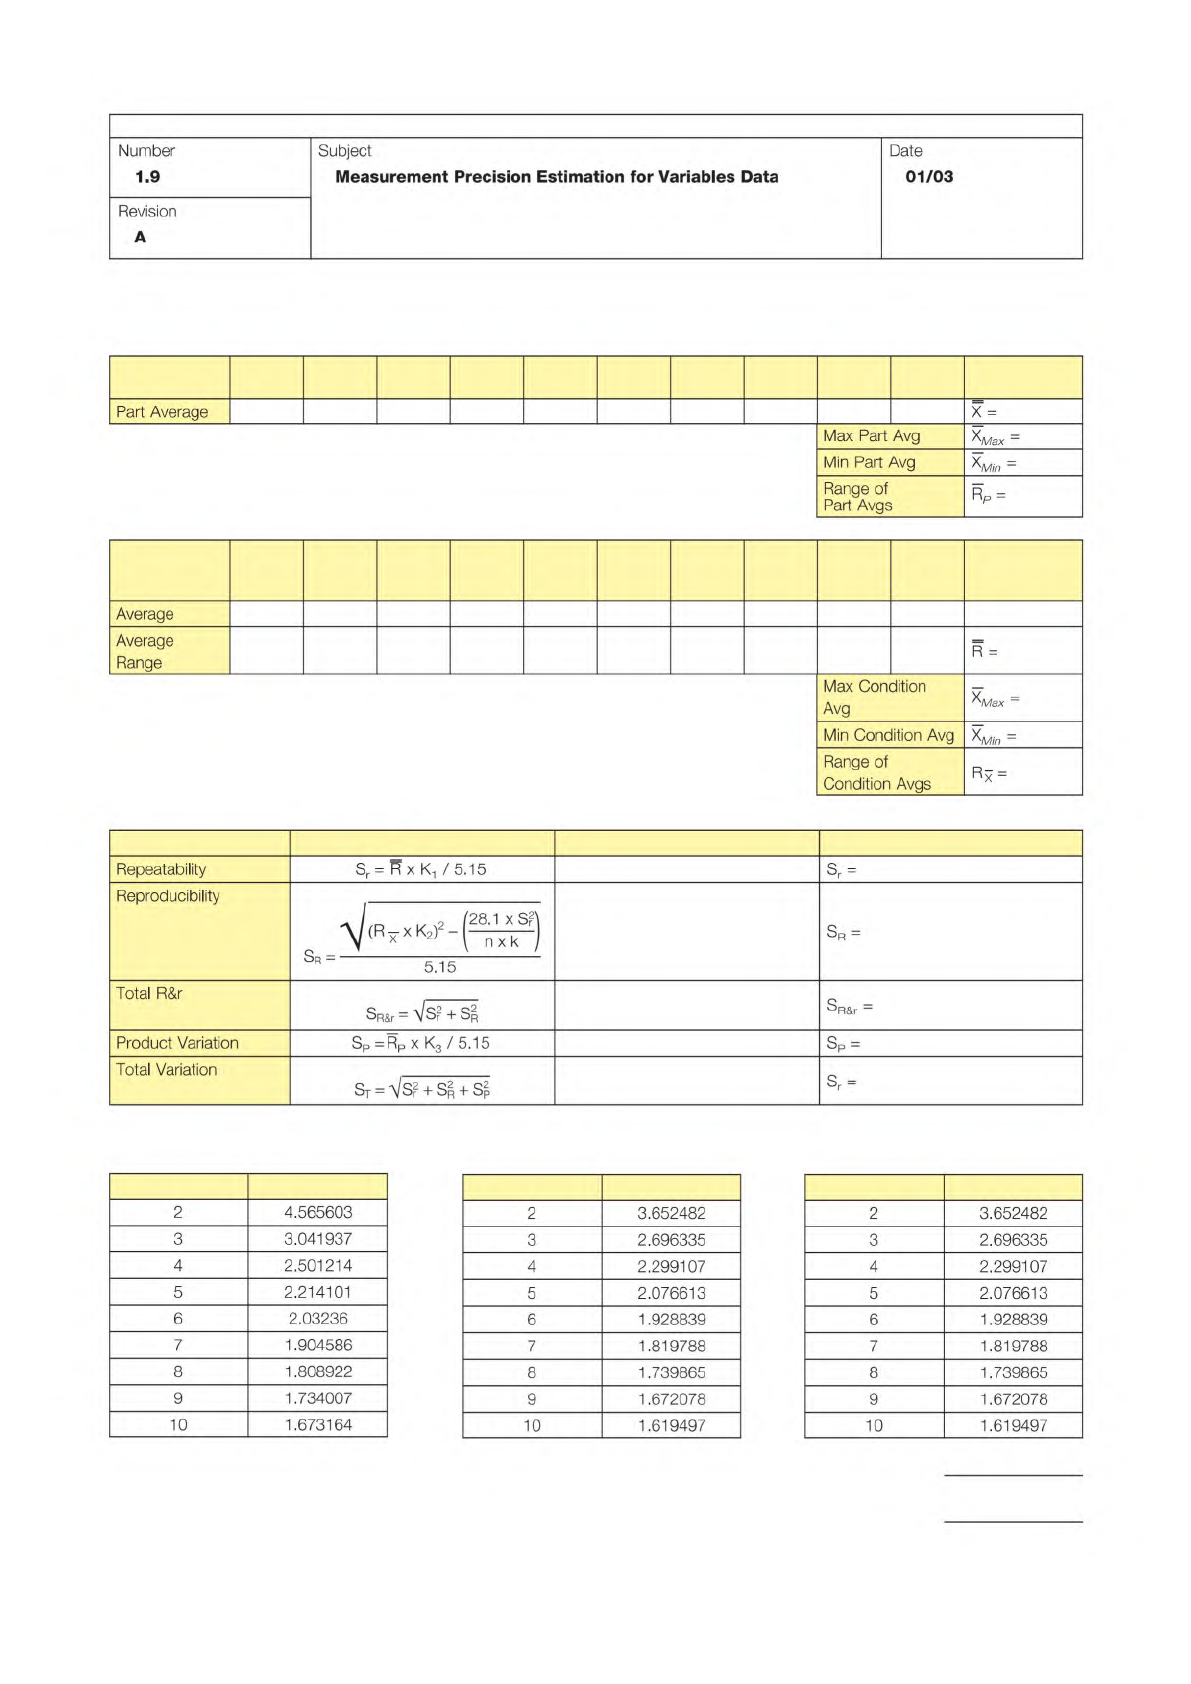
Measurement Precision Study – Calculation Sheet
Sample Data
Sample 1 2 3 4 5 6 7 8 9 10
Average Part
Average
Condition Data
Condition A B C D E F G H I J
Average
Condition
Range
Variability Calculations
Topic Equation Calculation Answer
K Factors
Readings K1
Parts K3Operations K2
IPC-TM-650
Page 9 of 10
Number
1.9
Subject
Measurement
Precision
Estimation
for
Variables
Data
Date
01/03
Revision
A
Part
Average
Max
Part
Avg
^Max
=
Min
Part
Avg
^Min
~
Range
of
Part
Avgs
R
f
=
Average
Average
Range
R
=
Max
Condition
Avg
^Max
-
Min
Condition
Avg
义
Min
二
Range
of
Condition
Avgs
Rx
=
Repeatability
Sr=
Rx
K-]
/5.15
=
Reproducibility
「由尹修-普
蓝)
Sr-
5.15
Sr
二
Total
R&r
SR&r
=
dsw
+
SR&r
=
Product
Variation
Sp
=
Rp
x
K3
/
5.1
5
SP
二
Total
Variation
ST
=
“S
普
+
S[
+
=
2
4.565603
3
3.041937
4
2.501214
5
2.214101
6
2.03236
7
1
.904586
8
1
.808922
9
1
.734007
10
1.673164
2
3.652482
3
2.696335
4
2.299107
5
2.076613
6
1
.928839
7
1.819788
8
1
.739865
9
1
.672078
10
1.619497
2
3.652482
3
2.696335
4
2.299107
5
2.076613
6
1
.928839
7
1.819788
8
1.739865
9
1
.672078
10
1.619497
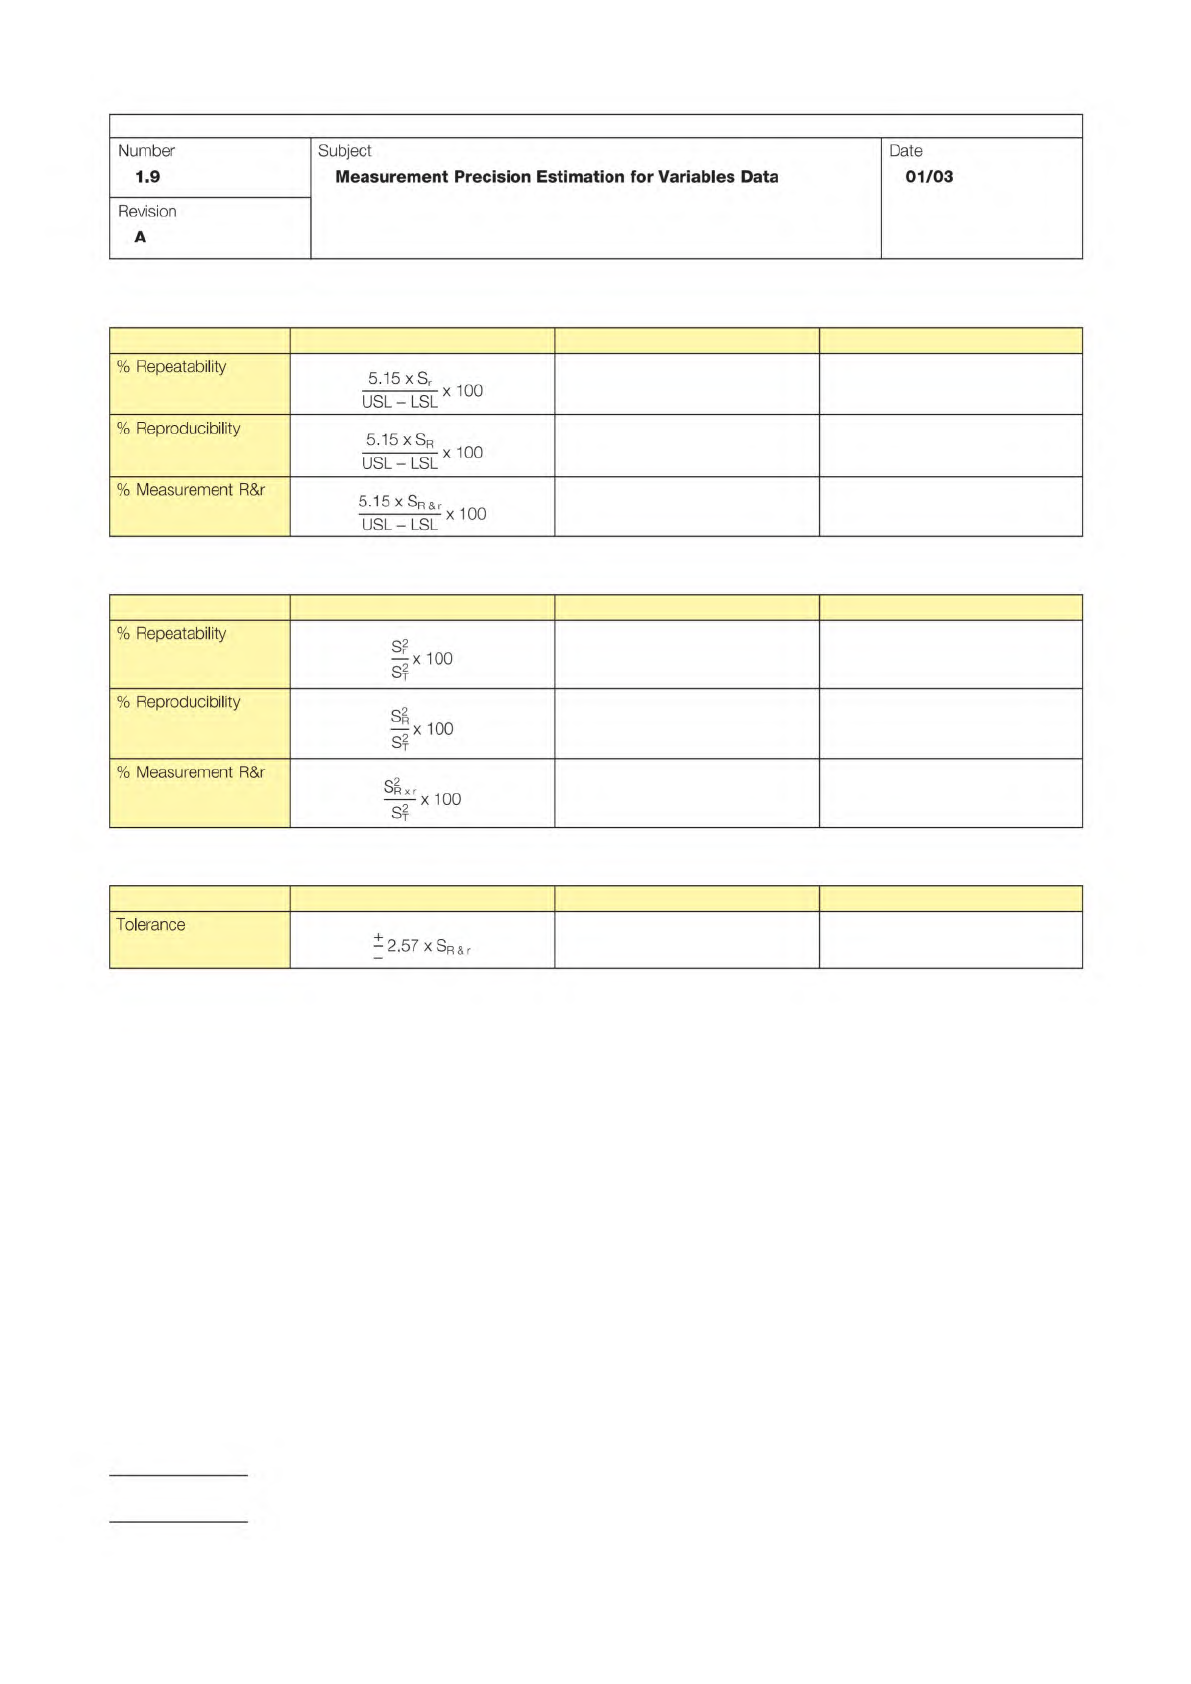
Comparisons to Specifications (Used when both specifications exist)
Topic Equation Calculation Answer
Comparisons to Total Variation
Topic Equation Calculation Answer
Measurement Tolerance
Topic Equation Calculation Answer
IPC-TM-650
Page 10 of 10
Number
1.9
Subject
Measurement
Precision
Estimation
for
Variables
Data
Date
01/03
Revision
A
%
Repeatability
5.15xSr
USL-LSLX1O°
%
Reproducibility
5.15
x
SR
USL-LSLX1O°
%
Measurement
R&r
5.15
x
SR&r
USL-LSLX1O°
%
Repeatability
「
x100
St
%
Reproducibility
SR
房
x100
%
Measurement
R&r
SrX|-
-^x
100
s?
Tolerance
2
2.57
x
SR&r
For Use with Test Method 1.9,
Measurement Systems Analysis for Variables Data
(IPC Measurement Precision Task Group (7-11a), Version 1.0)
Welcome to the Measurement Precision Calculator. This utility will help perform the calculations for Measurement Systems
Analysis (MSA) described in the IPC Test Method IPC-TM-1.9.
This software is useful in cases where the measurement data is recorded as variables data and recorded on a continuous
scale. The calculations allow for up to five repeated readings, taken on each of up to 10 samples by up to 10 test laborato-
ries or test conditions.
Please refer to the test method before beginning the study. The test method defines the terms and equations used in detail.
This User Guide provides detailed instructions for analyzing the MSA data on the Measurement Precision Calculator, and
how to draw conclusions from the metrics.
This software is an Excel workbook and includes the following:
• A blank spreadsheet to enter measurements
• A spreadsheet with example data
• A form for manual data entry, if desired
• Further information on the K factors used in the calculations
The goal in preparing this workbook was to keep it as simple and easy to implement as possible, but still provide a good
basic MSA. This procedure has been used many times and can often be completed with as little as an hour’s work on each
of three consecutive days. This method provides a good initial assessment. It is quick and easy enough to be used on all
tests, current and new. It can help isolate cases where further analysis is needed. It is useful both on current production tests
and as a test validation review for new designs.
This spreadsheet has been tested with the Excel versions included with Office 97 and Office 2000. It does not use macros,
so compatibility problems have been minimized. The sheets were formatted to print on 8-1/2 by 11 pages on most laser and
ink jet printers.
Begin by determining the measurement processes to be evaluated. All measurements are candidates for a study. In every
case where we perform a measurement, we deserve to know the precision of the measurement. Every measurement could
be followed by a ‘‘± X’’, where ‘‘X’’ would represent the tolerance of the measurement.
The secret to performing a good MSA is to prepare well. The first step in preparing the MSA is to identify all the MSA
candidates. Begin by identifying the measurements being performed. List the equipment needed, the parts tested, and the
set-ups required. For each piece of equipment, note the ranges used. The complete list of MSA candidates includes all com-
binations of all tests, equipment, set-ups, ranges and all products.
As in many cases, this list probably includes far more potential candidates for an MSA than time or budget restrictions will
allow. So one must identify the top candidates and make sure they begin with the most critical first.
So, the second step in preparing the MSA is to prioritize the candidates. The best ranking method for one’s situation will
probably be unique, but there are several factors to consider.
1
January
2003
Users
Guide
Measurement
Precision
Calculator
Users
Guide
Introduction
Preparing
for
the
study