IPC-TM-650 EN 2022 试验方法--.pdf - 第446页
Figure 4 Generalized Resonat or Pa ttern Card Showing D imensions of T able 1 and Made of L aminate M atching th e Nominal Permittivity of Material to be T ested Figure 5 Base Stripline Board with Copp er Foil and Dielec…
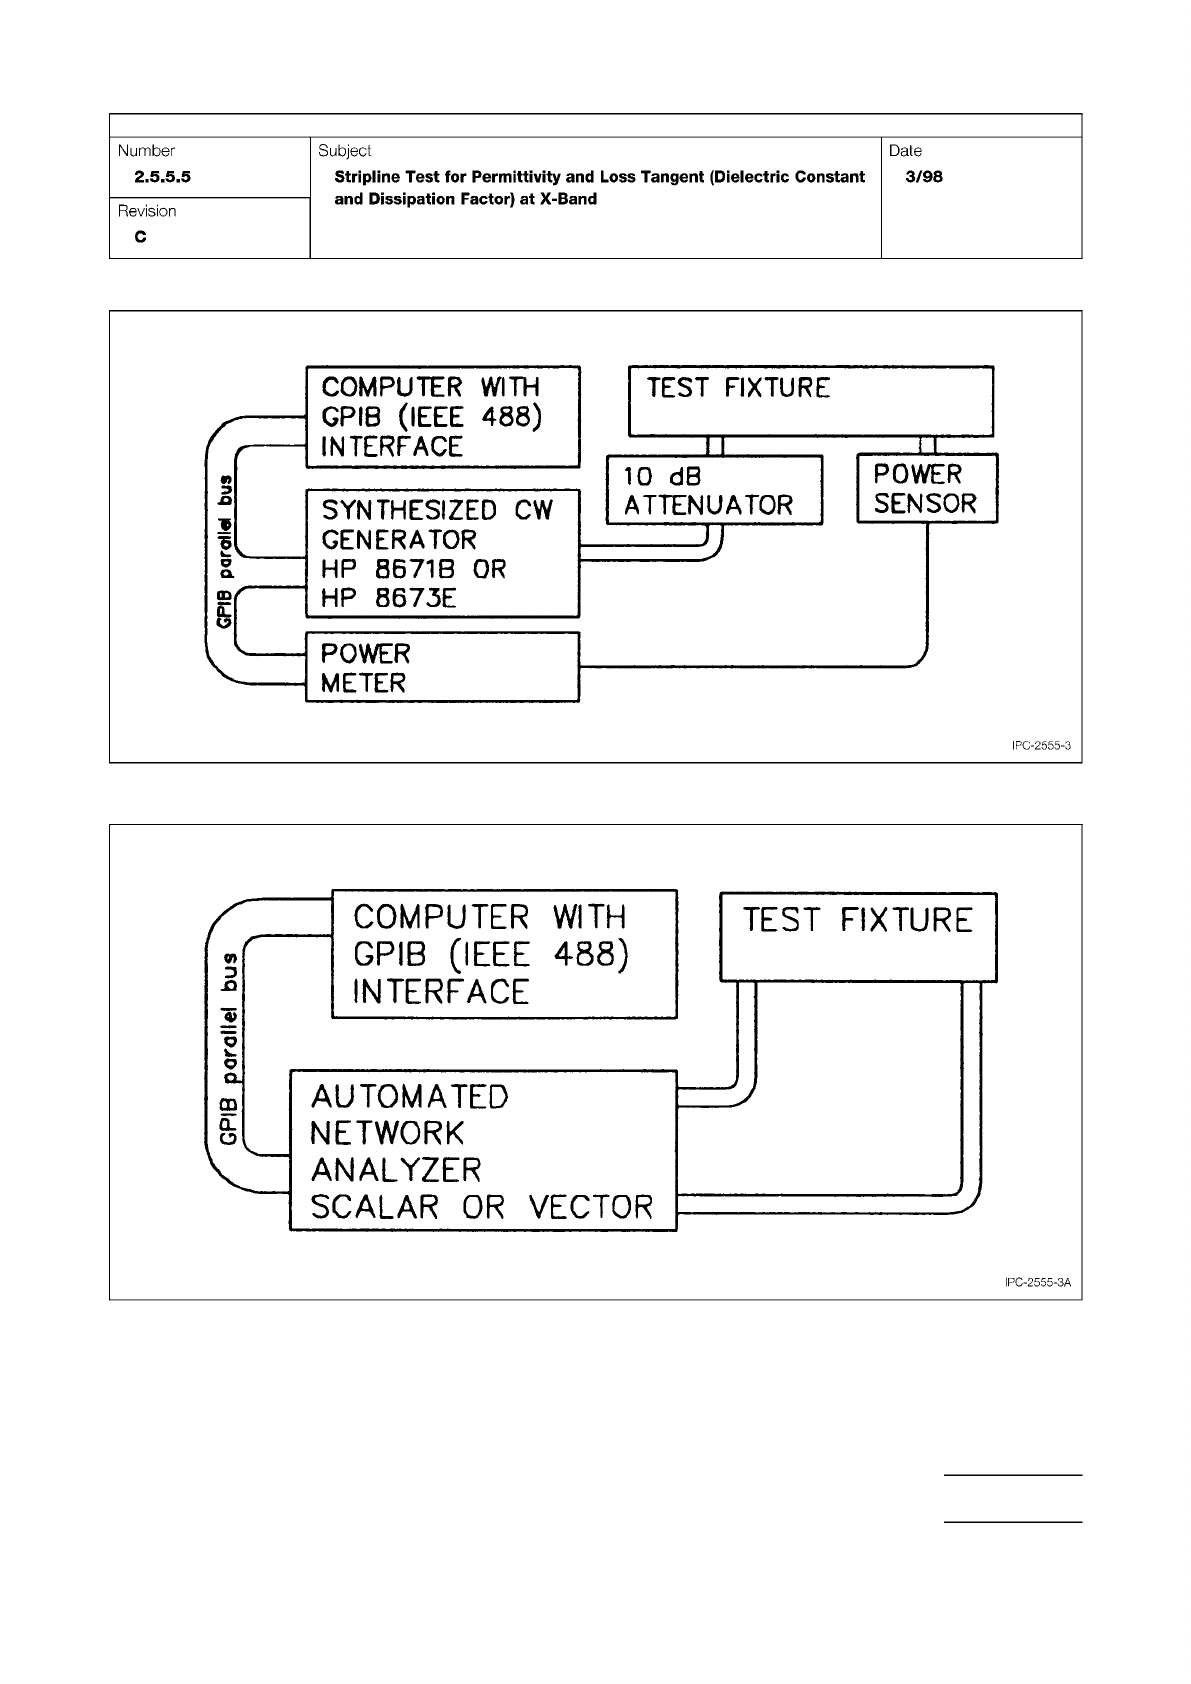
Figure 3 Simplified Automated Permittivity Test Setup
Figure 3A Automated Network Analyzer for Permittivity Test Setup
IPC-TM-650
Page 13 of 25
Number
2.5.5.5
Subject
Stripline
Test
for
Permittivity
and
Loss
Tangent
(Dielectric
Constant
and
Dissipation
Factor)
at
X-Band
Date
3/98
Revision
C
<7=
COMPUTER
WITH
GP
旧
(IEEE
488)
INTERFACE
SYNTHESIZED
CW
GENERATOR
HP
8671B
OR
HP
8673E
POWER
METER
TEST
FIXTURE
II
1
1
10
dB
ATTENUATOR
POWER
SENSOR
IPC-2555-3
COMPUTER
WITH
sf
GP
旧
(
IEEE
488)
2
INTERFACE
虫
AUTOMATED
忌
J
NETWORK
ANALYZER
SCALAR
OR
VECTOR
TEST
FIXTURE
—
7
IPC-2555-3A
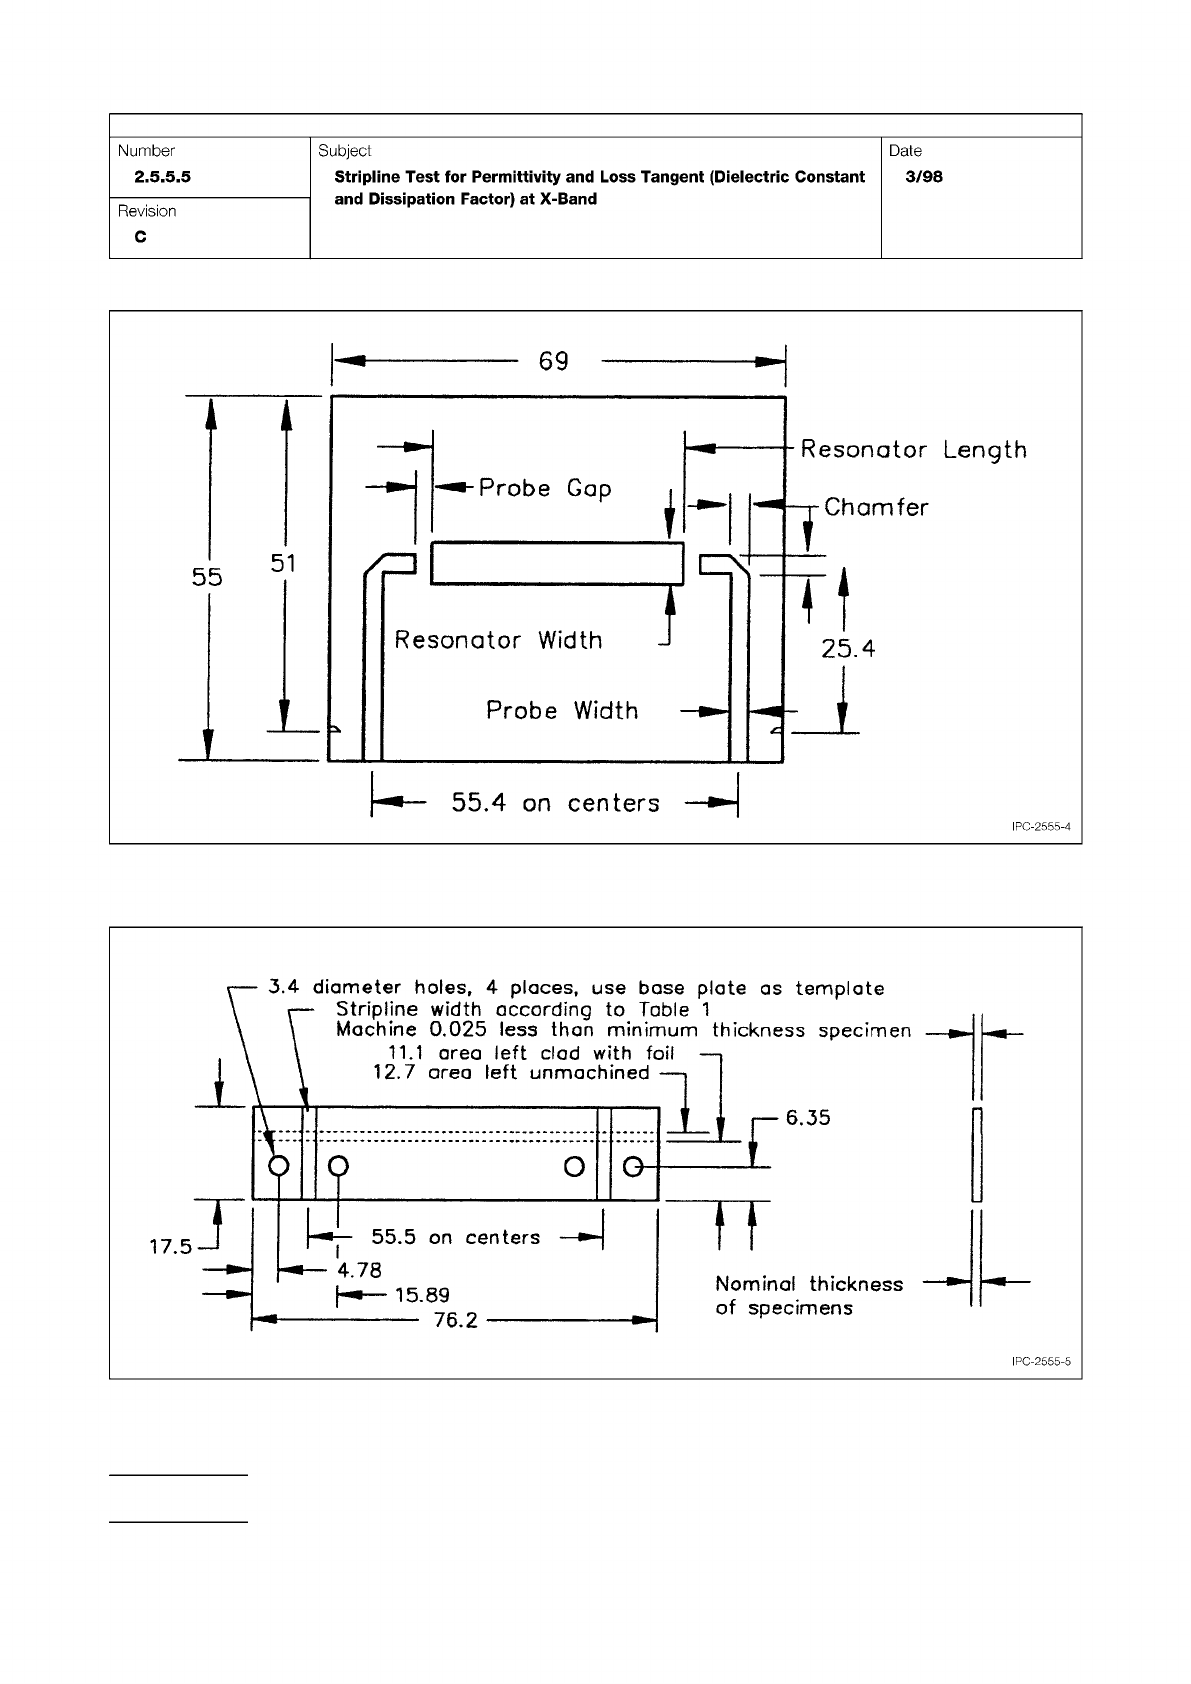
Figure 4 Generalized Resonator Pattern Card Showing Dimensions of Table 1 and Made of Laminate Matching the
Nominal Permittivity of Material to be Tested
Figure 5 Base Stripline Board with Copper Foil and Dielectric Matching the Nominal Permittivity of the Material to be
Tested
IPC-TM-650
Page 14 of 25
Number
2.5.5.5
Subject
Stripline
Test
for
Permittivity
and
Loss
Tangent
(Dielectric
Constant
and
Dissipation
Factor)
at
X-Band
Date
3/98
Revision
C
_L
6.35
Nominal
thickness
of
specimens
55.5
on
centers
4.78
H*—
15.89
76.2
3.4
diameter
holes,
4
places,
use
base
plate
as
template
Stripline
width
according
to
Table
1
Machine
0.025
less
than
minimum
thickness
specimen
11.1
area
left
clad
with
f
1
2.7
area
left
unmachined
17.5
―
B»-
O
G
IPC-2555-5
V1(f) and V2(t) is a respective ordered frequency pair A1(f),
φ1(f) and A2(f), φ2(f).
The attenuation, Att(f), and phase constant, β(f), are com-
puted with Equations 5-10 and 5-11.
Γ(,) = α(,) + jβ(,) =
−
1
l
1
– l
2
1n
(
A
1
(,)
A
2
(,)
)
+ j
φ
1
(,) − φ
2
(,)
l
1
− l
2
[5-10]
Att(,) = 20 log (e
Re(Γ(,)
)
β(,) = Im (Γ(F))
[5-11]
5.3.6.3 SPP Broadband Complex Permittivity Extraction
5.3.6.3.1 Frequency Dependent Line Parameters
A 2D
field solver is used to calculate R(f), L(f), C(f), and G(f) per unit
length based on the actual cross sectional dimensions, the
metal resistivity ρ, and low frequency ε
r
and tanδ outlined
above. A 2D solver that assures a causally related calculation
of L-R and C-G is recommended. The initial calculation can
contain a few initial points for ε
r
and tanδ that are used as
starting values for the high-frequency range, for example
3 GHz to 20 GHz. Based on the calculated R(f), L(f), C(f), and
G(f), the attenuation and phase constant are calculated from
Equation 5-12.
Γ(,) = α(,) + jβ(,) =
√
(R + jωL)(G + jωC)
[5-12]
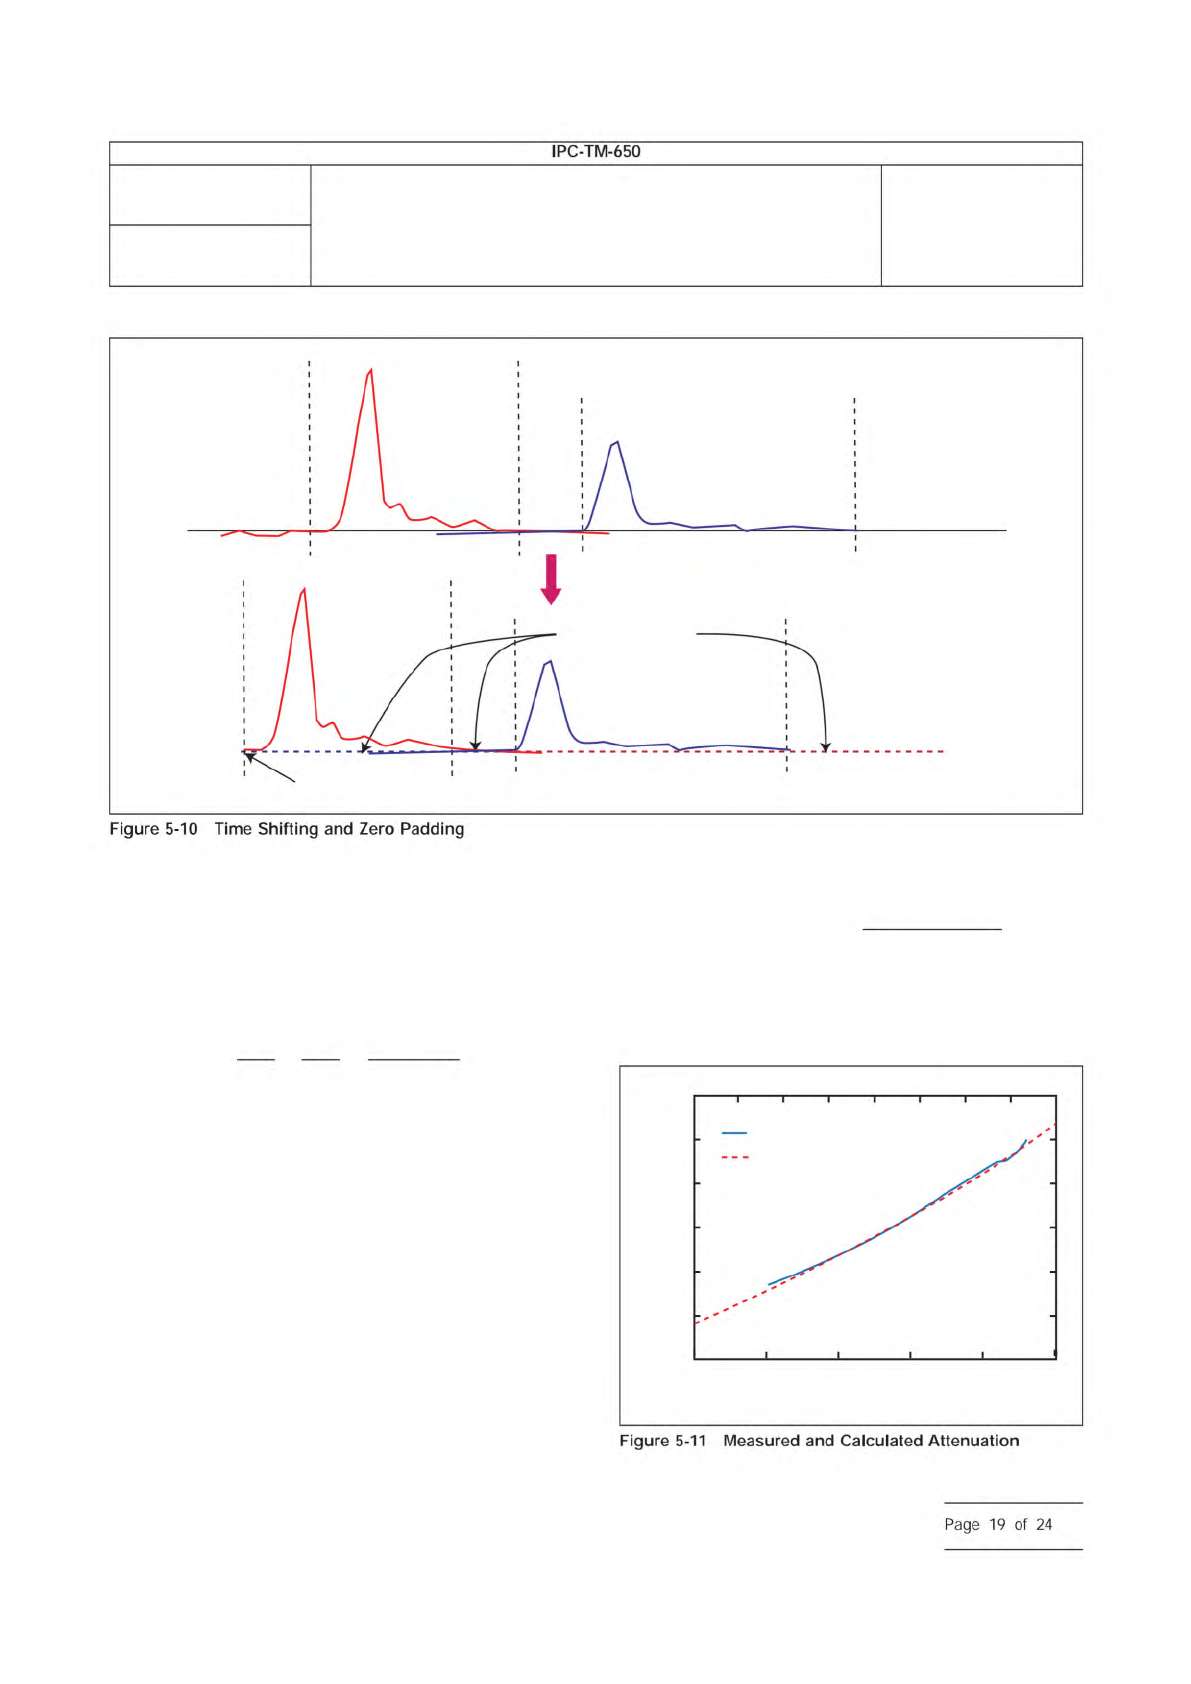
The measured and calculated attenuation and phase are
compared to the measured values as shown in Figure 5-11
and Figure 5-12.
IPC-25512-5-10
0V, 0S
Zero Padded
IPC-25512-5-11
Attenuation (dB/cm)
0.05
0.1
0.2
0.5
1
2
5
1 2 5 10 20 50
Frequency (GHz)
Measured
Calculated
Number
2.5.5.12
Subject
Test Methods to Determine the Amount of Signal Loss on
Printed Boards
Date
07/12
Revision
A
IPC-TM-650
—
Figure
5-10
Time
Shifting
and
Zero
Padding
Figure
5-11
Measured
and
Calculated
Attenuation
Page
19
of
24