IPC-TM-650 EN 2022 试验方法--.pdf - 第51页
Measurement Systems Analysis For Variables Data: Measurement Precision Calculator Version 1.0, August 2002 Introduction Welcome to the Measurement Precision Calculator. This workbook will help perform the calculations fo…
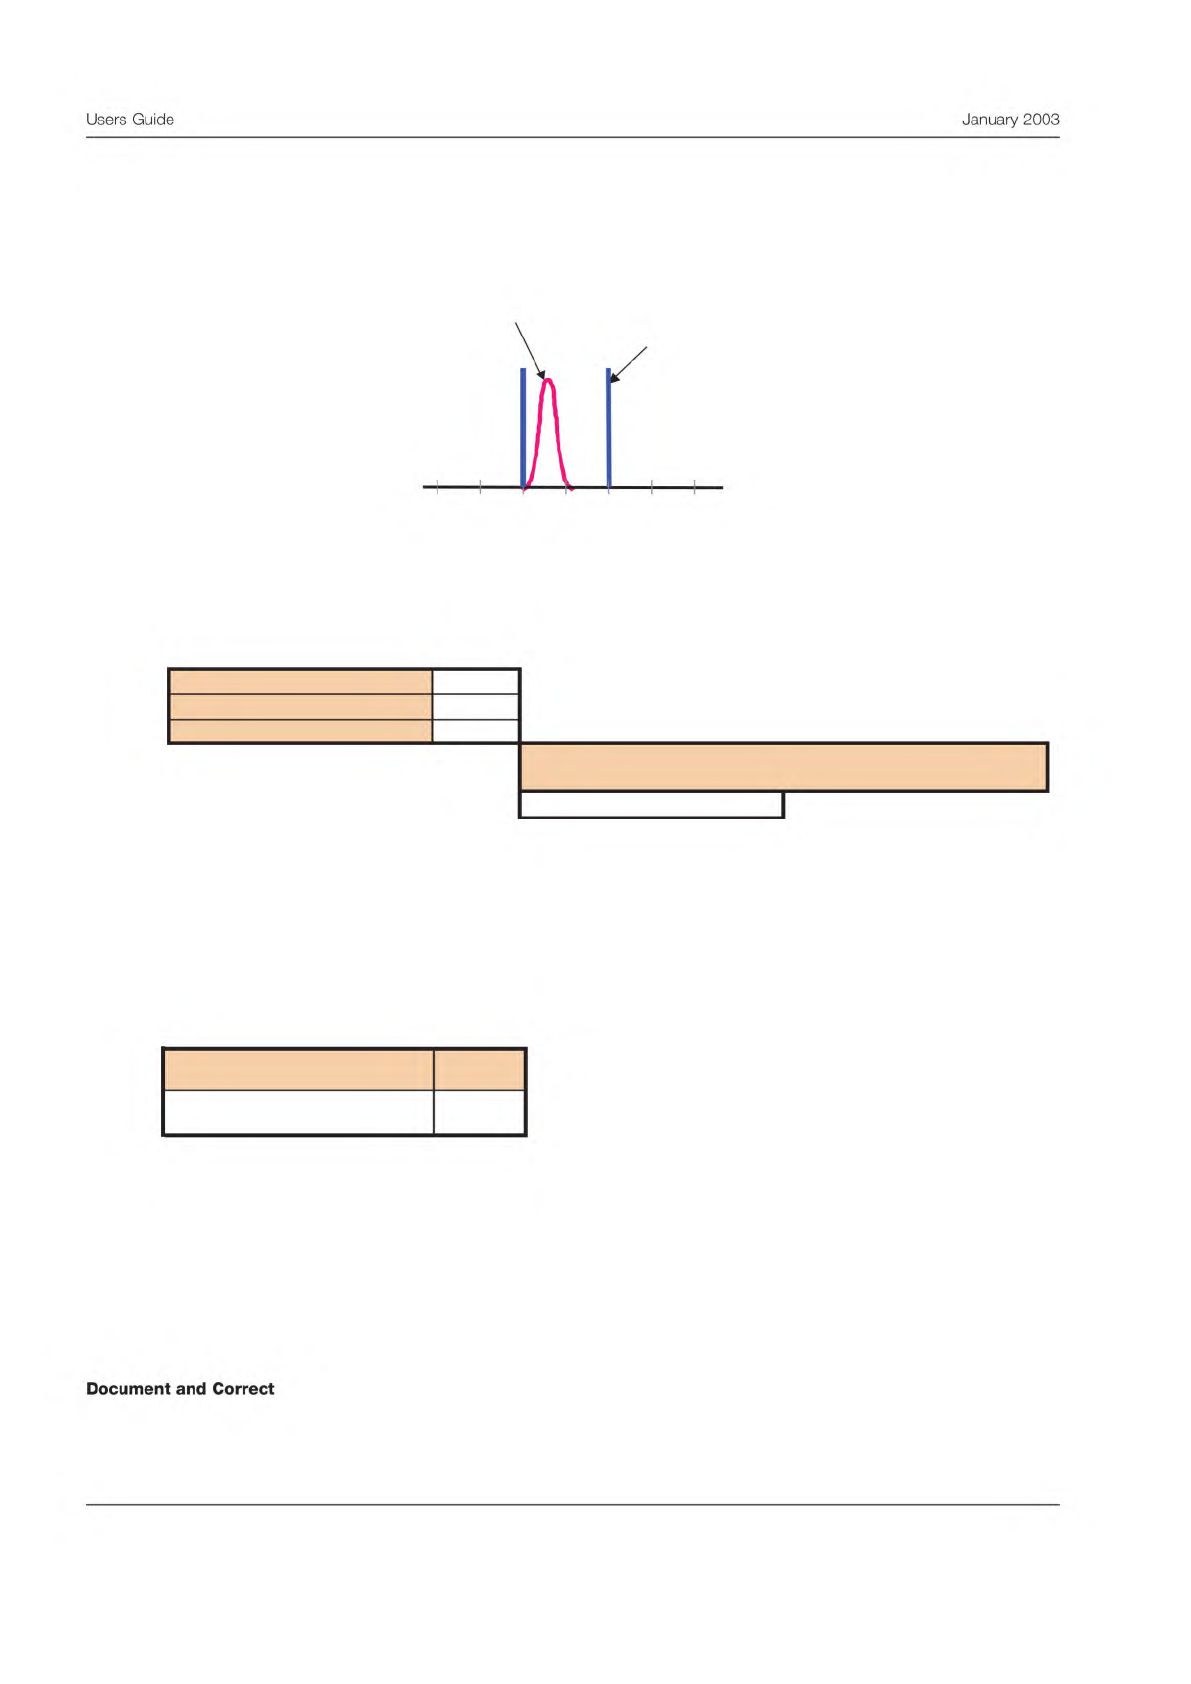
A graph showing only the relationship between the measurement variability and the spec limits is shown below. Here the
normal curve represents only the variability of a given measurement. The curve clearly consumes half the spec width. Place-
ment of the curve in the spec interval is arbitrary. The curve is formed by drawing it with a total width of six times the
S
R&r
.
Sometimes there is only one spec, and the table above will be blank. For those situations, the next table compares measure-
ment variability to the total observed variation.
The numbers in the table are again percentages, but this time percentages of total variation. In this example, the measure-
ment variation is 23% of the overall total observed variation. The same guidelines apply, except measurements would con-
sume less than 10% of the total variation. Unacceptable measurements would consume more than 30%. This example falls
in the gray zone in between; not good enough, with improvement recommended.
The final metric in the scorecard provides a measurement tolerance. The stated value forms a 99% confidence interval. The
tolerance is shown in this example:
A ‘‘confidence interval’’ is one of those strange statistical concepts that ought to be easy to describe, but somehow become
garbled when translated from equation to English. Let us try to state it clearly:
We make a measurement to estimate the actual, but unknown, performance point of the product. There is a 99% chance that
the actual performance will be within ± the measurement tolerance of the measurement.
In this example, any given gasket measurement will have a tolerance of ± 0.111 mm. The real gasket thickness is within ±
0.111 mm of our measurement.
The final step is to determine lessons learned from the MSA and document any changes to the test procedure. If the evalu-
ation indicates the test procedure needs to be improved, these improvement projects should be undertaken as soon as pos-
sible.
0.2 0.4 0.6 0.8 1.0 1.2 1.4
Spec
limits
Measurement
error
Comparison to Total Variation
% Repeatability 2.76653 Percent of total variability used by repeatability error
% Reproducibility
2.69817
Percent of total variability used by reproducibility error
% Measurement R&r
5.46469
Percent of total variability used by measurement error
Compared to the total variability, the precision of
this measurement:
Is adequate
Measurement Tolerance
Measurement Tolerance
Units
mm
On the basis of this study, there is a 99% chance that
this interval around the measured product performance
will contain the actual product performance level.
+/- 0.111243938
10
Users
Guide
January
2003
Document
and
Correct

Measurement Systems Analysis For Variables Data:
Measurement Precision Calculator
Version 1.0, August 2002
Introduction
Welcome to the Measurement Precision Calculator. This workbook will help
perform the calculations for Measurement Precision Studies as described
in the IPC test method IPC-TM 1.9.
This software is useful in cases where the measurement data is recorded
as variables data and recoreded on a continuous scale.
Please refer to the test method before beginning the measurement precision study.
The test method defines the terms and equations used in detail.
Also refer to the User Guide for detailed instructions..
This workbook includes the following
- A blank spreadsheet to enter measurements
- A spreadsheet with example data
- A form for manual data entry, if desired.
- Further information on the K factors used in the calculations
The title cells on the spread sheet have been color coded to aid understanding.
The following is the color key:
Color
General title
Cells for user to enter data
Title cells for test condition related data
Title cells for data related to repeated readings
Title cells for sample related data
Title cell for calculated data
Usage

1 Scope
This method is to be used as a guideline for pre-
paring a metallographic specimen of printed boards. The fin-
ished microsection is used for evaluating the quality of the
laminate system and plated structures (plated-through holes,
solder joints, vias, etc.). The plated structures can be evalu-
ated for characteristics of the copper foils, plating, and/or
coatings to determine compliance with applicable perfor-
mance specification requirements.
Metallographic sample preparation is regarded by many as
essentially a highly developed skill; this method describes
those techniques that have been found to be generally
acceptable. It does not attempt to be so specific as to not
allow acceptable variations that can differentiate metallogra-
phers. Furthermore, the success of these techniques remains
highly dependent upon the skill of the individual metallogra-
pher.
Note: These microsection techniques are processes and are
intended as guidelines and thus variations are allowed.
Note: The use of the materials listed in Section 4 may be lim-
ited or forbidden in some environments. Please review the
Safety Data Sheet (SDS) for the materials being used.
1.1 Method A (Manual) Description
Manual metallo-
graphic preparation of sample(s).
1.2 Method B (Semi or Automatic) Description
Semi or
automatic metallographic preparation utilizing dedicated
microsection equipment to prepare multiple samples.
2 Applicable Documents
IPC-MS-810
Guidelines for High Volume Microsectioning
ASTM E 3
Standard Methods of Preparation of Metallo-
graphic Specimens
3 Test Specimens
A test coupon or printed board to be
inspected per the applicable performance specification, which
includes the features to be evaluated (i.e., plated holes or
laminate). This may require multiple microsections.
4 Apparatus or Material
4.1
Sample removal method (see IPC-MS-810 for the best
method to meet your needs).
4.2
Personal Protective Equipment (e.g., eye protection,
gloves)
4.3
Ventilation system (Fume Hood) in compliance with
material SDS (as required)
4.4
Mount molds.
4.5
Smooth, flat mounting surface.
4.6
Release agent (optional).
4.7
Sample supports (optional for Method A).
4.8
Sample alignment tools (Method B).
4.9
Metallographic wet grinding/polishing system or equip-
ment (as applicable).
4.10
Low magnification visual aid (reticle optional)
4.11
Metallographic microscope capable of minimum con-
struction integrity magnifications as specified in procurement
documentation.
4.12
Vacuum pump and desiccator or pressure pot
(optional).
4.13
Potting material (maximum cure temperature 93 °C
[200 °F]). (For discussion on selection of potting material refer
to IPC-MS-810.)
4.14
Sandpaper. Federation of European Producers of
Abrasives (FEPA)(ISO 6344) paper backed Silicon Carbide P
(coated) abrasive medium P80-P4000 (United States CAMI
(Coated Abrasive Manufacturers Institute) grit range: 80-1200.
4.15
Polishing Cloths. A hard, low, or no nap cloth for rough
and intermediate polishing, and a soft, woven, or medium nap
cloth for final polishing.
4.16
Oxide or colloidal silica polishing suspension (final pol-
ish, 0.3 - 0.04 µm [11.8 - 1.57 µin]). (Optional).
3000 Lakeside Drive, Suite 105N
Bannockburn, IL 60015-1249
IPC-TM-650
TEST METHODS MANUAL
Number
2.1.1
Subject
Microsectioning, Manual and Semi or Automatic
Method
Date
6/15
Revision
F
Originating Task Group
Microsection Subcommittee (7-12)
Material in this Test Methods Manual was voluntarily established by Technical Committees of IPC. This material is advisory only
and its use or adaptation is entirely voluntary. IPC disclaims all liability of any kind as to the use, application, or adaptation of this
material. Users are also wholly responsible for protecting themselves against all claims or liabilities for patent infringement.
Equipment referenced is for the convenience of the user and does not imply endorsement by IPC.
Page 1 of 8
Association
Connecting
Electronics
Industries