IPC-TM-650 EN 2022 试验方法--.pdf - 第529页
Figure 1 Oscilloscope Figure 2 Co nnecting Sample Figure 3 Cr osstalk The Institute for Int erconnecting and Packaging E lectronic Circuits 2215 Sanders Road • Northbrook, IL 60062 Material in this T est M ethods Manual …
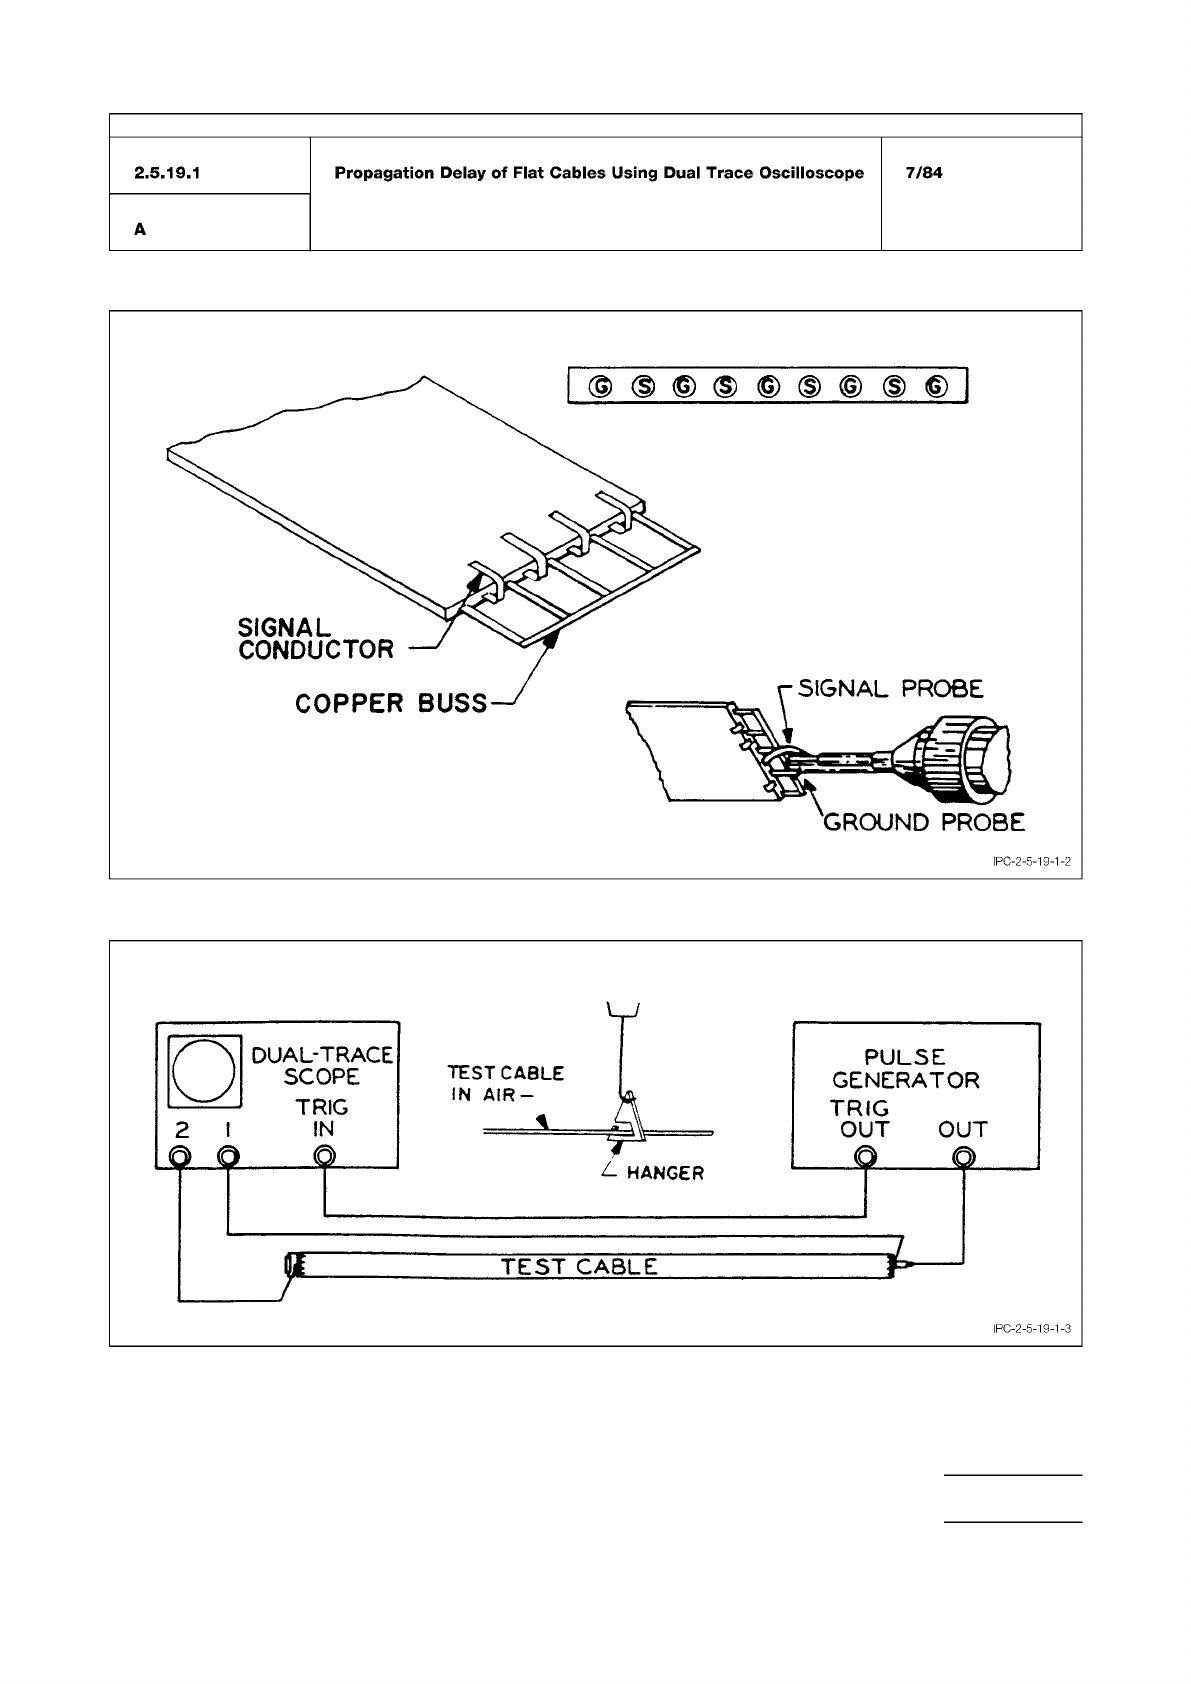
Figure 3 Cable Preparation and Cable Connection
Figure 4 Test Cable Hookup
IPC-TM-650
Number
Subject Date
Revision
Page 3 of 4
2.5.19.1
Propagation
Delay
of
Flat
Cables
Using
Dual
Trace
Oscilloscope
7/84
A
IPC-2-5-19-1-3
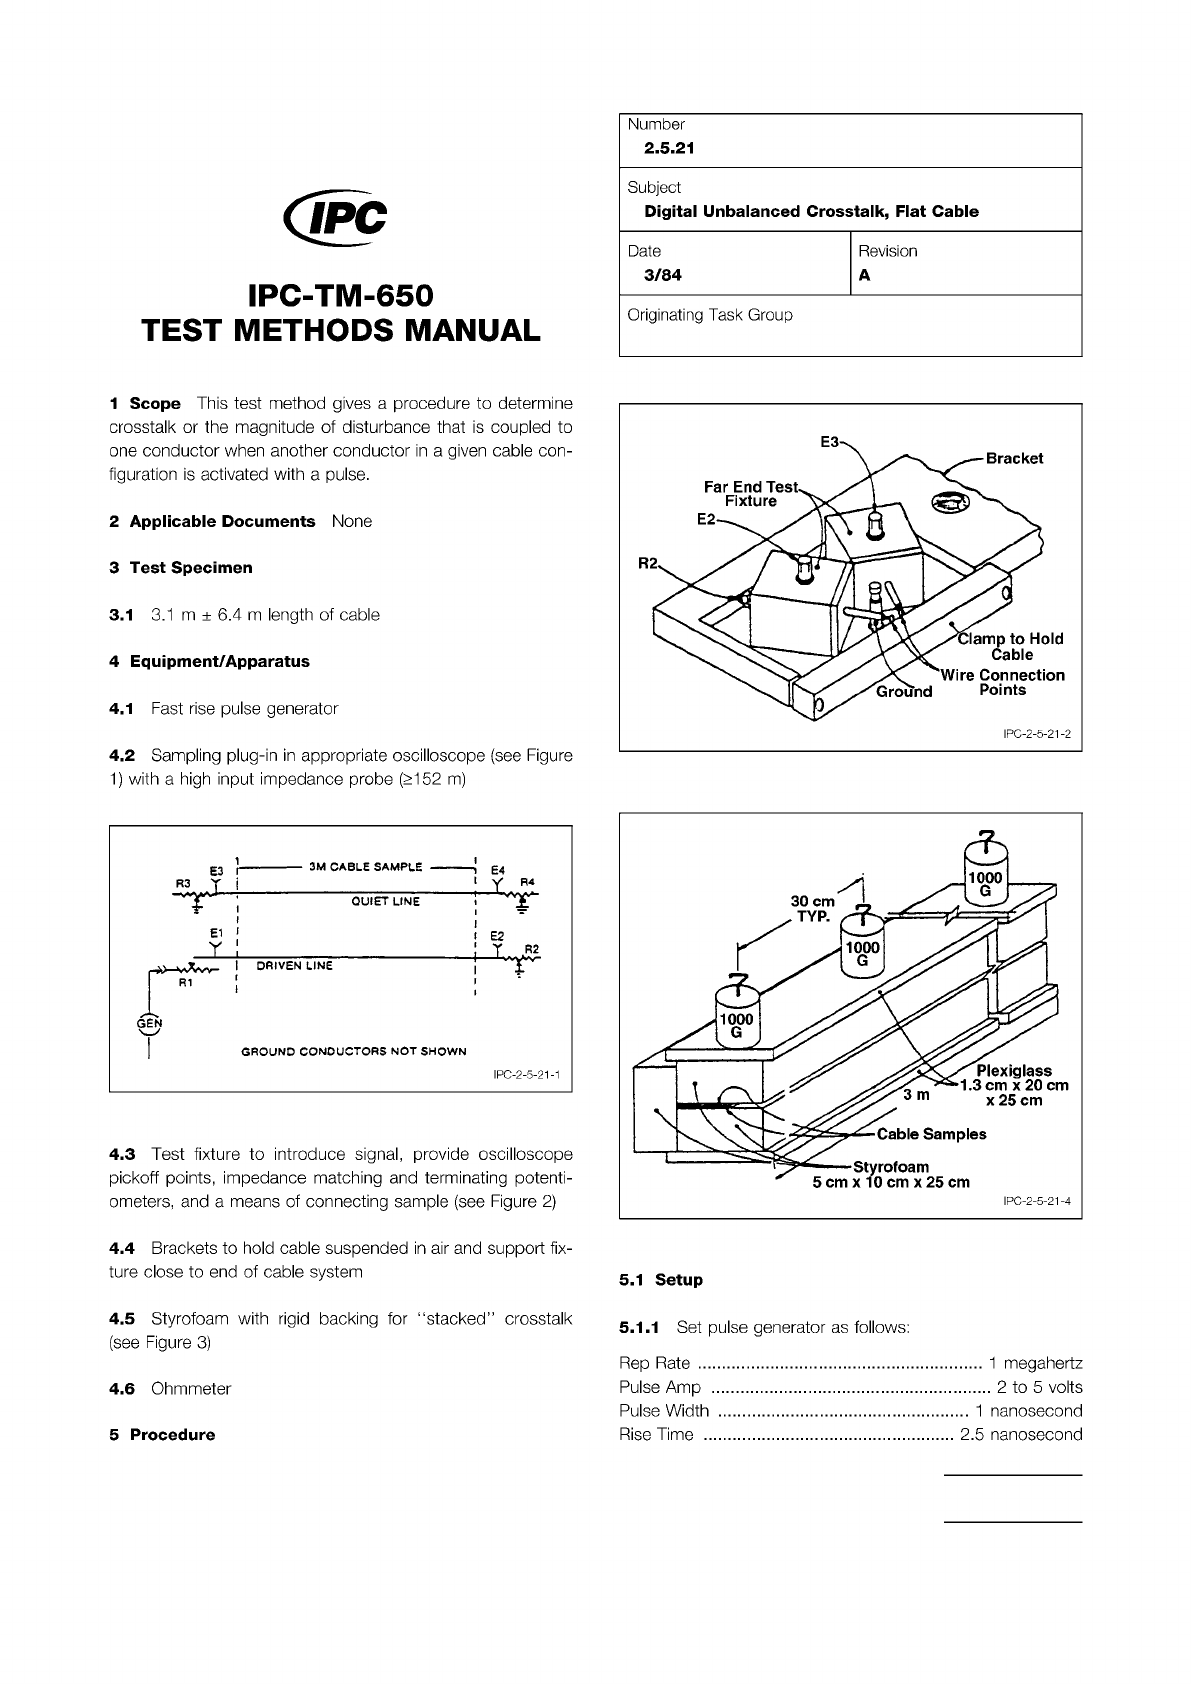
Figure 1 Oscilloscope
Figure 2 Connecting Sample
Figure 3 Crosstalk
The Institute for Interconnecting and Packaging Electronic Circuits
2215 Sanders Road • Northbrook, IL 60062
Material in this Test Methods Manual was voluntarily established by Technical Committees of the IPC. This material is advisory only
and its use or adaptation is entirely voluntary. IPC disclaims all liability of any kind as to the use, application, or adaptation of this
material. Users are also wholly responsible for protecting themselves against all claims or liabilities for patent infringement.
Equipment referenced is for the convenience of the user and does not imply endorsement by the IPC.
Page 1 of 2
回
IPC-TM-650
TEST
METHODS
MANUAL
1
Scope
This
test
method
gives
a
procedure
to
determine
crosstalk
or
the
magnitude
of
disturbance
that
is
coupled
to
one
conductor
when
another
conductor
in
a
given
cable
con¬
figuration
is
activated
with
a
pulse.
2
Applicable
Documents
None
3
Test
Specimen
3.1
3.1
m
±
6.4
m
length
of
cable
4
Equipment/Apparatus
4.1
Fast
rise
pulse
generator
4.2
Sampling
plug-in
in
appropriate
oscilloscope
(see
Figure
1)
with
a
high
input
impedance
probe
Q152
m)
GROUND
CONDUCTORS
NOT
SHOWN
I
PC-2-5-21-1
4.3
Test
fixture
to
introduce
signal,
provide
oscilloscope
pickoff
points,
impedance
matching
and
terminating
potenti¬
ometers,
and
a
means
of
connecting
sample
(see
Figure
2)
4.4
Brackets
to
hold
cable
suspended
in
air
and
support
fix¬
ture
close
to
end
of
cable
system
4.5
Styrofoam
with
rigid
backing
for
"stacked”
crosstalk
(see
Figure
3)
4.6
Ohmmeter
5
Procedure
Number
2.5.21
Subject
Digital
Unbalanced
Crosstalk,
Flat
Cable
Date
3/84
Revision
A
Originating
Task
Group
5.1
Setup
5.1.1
Set
pulse
generator
as
follows:
.....
1
megahertz
2
to
5
volts
..
1
nanosecond
2.5
nanosecond
Rep
Rate
...
Pulse
Amp
Pulse
Width
Rise
Time
..

measurement procedures. ESD control components can
include static dissipative mats, deionizer systems, and opera-
tor gowning.
4.4.2 Premeasurement Checks
The test measurement
should be performed after the completion of the field check
process. Ensure that the plane of the signal line of a microstrip
(or embedded microstrip) structure is at least a distance equal
to six times the width of the microstrip signal line from any
material (such as the testing table) that can affect the dielec-
tric environment of the microstrip line. If the tests are being
conducted with hand probe(s), care must be taken to ensure
that the hands and/or arms of the operator do not contact any
surface of the printed board over the transmission line being
tested. Probes should be applied to the test points with suffi-
cient force to ensure proper electrical contact between the
conductor and the probe assembly. Consistent application
(that is, force, angle of placement, etc.) of the probes onto the
test points is important to ensure repeatable measurement
results. Before recording any measurement results, ensure
that the TDR waveform is stable (that is, not drifting in ampli-
tude or time) otherwise measurement error will occur. Ensure
that the temperature and humidity of the test environment are
within TDR instrument specifications and are stable.
4.4.3 Method for Evaluation of Measurement Repeat-
ability
Measurement repeatability is described in IPC-TM-
650, Method 1.9. This method also describes a process to
evaluate the reproducibility of a measurement system for mul-
tiple operators, on different days, and when using different
instruments. This evaluation process should be followed and
a precision-to-tolerance ratio acceptable to the customer
obtained.
4.4.4 TDR Requirements
In general, the following
describes minimum TDR requirements. Improvement to these
requires agreement between customer and vendor.
4.4.4.1 EBW: TDR Requirements
The voltage measure-
ment resolution of the TDR unit
be at least 1% of the
step amplitude. Step aberrations should be ± 3% or less over
the zone 10 ns to 20 ps before step transition; +10%, -5% or
less for the first 300 ps following step transition; ±3% or less
over the zone 300 ps to 5 ns following step transition; ± 1%
or less over the zone 5 ns to 100 ns following step transition;
0.5% after 100 ns following step transition. The time base
accuracy
be less than 2 ps.
4.4.4.2 RIE: TDR Requirements
The voltage measure-
ment resolution of the TDR unit shall be within 1% of the step
amplitude. Step aberrations should be ± 3% or less over the
zone 10 ns to 20 ps before step transition; +10%, -5% or less
for the first 300 ps following step transition; ± 3% or less over
the zone 300 ps to 5 ns following step transition; ± 1% or less
over the zone 5 ns to 100 ns following step transition; 0.5%
after 100 ns following step transition. The time base accuracy
be less than ± 1% of full scaled used. The captured time
be at least twice the transit time and shall contain at
least 2000 samples. The time between samples
also be
less than 25 ps.
4.4.4.3 SPP: TDR Requirements
The voltage measure-
ment resolution of the TDR unit
be at least 1% of the
step amplitude. Step aberrations should be ± 3% or less over
the zone 10 ns to 20 ps before step transition; +10%, -5% or
less for the first 300 ps following step transition; ± 3% or less
over the zone 300 ps to 5 ns following step transition; ± 1%
or less over the zone 5 ns to 100 ns following step transition;
0.5% after 100 ns following step transition. The time base
accuracy
be less than 2 ps for delays less than 100 ns.
4.4.4.4 SET2DIL: TDR Requirements
The voltage mea-
surement resolution of the TDR unit
be at least 1% of
the step amplitude. Step aberrations should be ± 3% or less
over the zone 10 ns to 20 ps before step transition; +10%,
-5% or less for the first 300 ps following step transition; ± 3%
or less over the zone 300 ps to 5 ns following step transition;
± 1% or less over the zone 5 ns to 100 ns following step tran-
sition; 0.5% after 100 ns following step transition. The time
base accuracy
be less than 1 ps.
4.4.5 TDR Risetime Requirement
The procedure
depicted in Figure 4-5 can be used to determine the rise time
or maximum slope of the TDR measurement system through
the probe tip. This is done to ensure that there is sufficient
high frequency content within the step pulse that is to be
injected into the device under test (DUT) for the respective test
method.
The SIU is a static isolation unit designed to eliminate
static damage to the TDR sampling head. It may be included
within the TDR instrumentation.
4.4.5.1 EBW Risetime
The rise time (10%-90%) for EBW
contain sufficient spectral content as agreed upon
between vendor and customer base on the printed board
application with the open tip of the probe. For EBW, hold the
probe in air see Figure 4-5 and measure the maximum slope
of the rise time of the step response (in Megavolts/second)
and/or the risetime. This value should be compared to the
Number
2.5.5.12
Subject
Test Methods to Determine the Amount of Signal Loss on
Printed Boards
Date
07/12
Revision
A
IPC-TM-650
shall
shall
shall
shall
shall
shall
Note:
shall
shall
Page
10
of
24