IPC-TM-650 EN 2022 试验方法--.pdf - 第561页
1 Scope This test m ethod is used to qua ntif y t he deleteri- ous effects o f fabrication, process or handl ing re sidues on Surface Insulation Resistance (SIR) in the pre sence of mois- ture. The electrodes are long pa…
Number
Subject
Date Revision
Originating Task Group
MaterialinthisTestMethodsManualwasvoluntarilyestablishedbyTechnicalCommitteesofIPC.Thismaterialisadvisoryonly
anditsuseoradaptationisentirelyvoluntary.IPCdisclaimsallliabilityofanykindastotheuse,application,oradaptationofthis
material.Usersarealsowhollyresponsibleforprotectingthemselvesagainstallclaimsorliabilitiesforpatientinfringement.
EquipmentreferencedisfortheconvenienceoftheuseranddoesnotimplyendorsementbyIPC.
3000 Lakeside Drive, Suite 105 N
Bannockburn, Illinois 60015-1249
IPC-TM-650
TEST METHODS MANUAL
1 Scope
This test method describes a way to measure the relative permittivity
(
e
r
) and loss tangent (tan
d
) (also called dielectric constant,
Dk, and dissipation factor, Df) of base materials for printed boards at frequencies from 1 GHz to 20 GHz using a split post
dielectric resonator (SPDR).
2 Applicable Documents
2.1 IPC-TM-650 Method 2.5.5.2 Dielectric Constant and Dissipation Factor of Printed Wiring Board Material –
Clip Method
2.2 IPC-TM-650 Method 2.5.5.3 Permittivity (Dielectric Constant) and Loss Tangent (Dissipation Factor) of Materials
(Two Fluid Cell Method)
2.3 IPC-TM-650 Method 2.5.5.5 Stripline Test for Permittivity and Loss Tangent (Dielectric Constant and Dissipation Factor)
at X-Band
2.4 IPC-TM-650 Method 2.5.5.5.1 Stripline Test for Complex Relative Permittivity of Circuit Board Materials to 14 GHz
2.5 IPC-TM-650 Method 2.5.5.9 Permittivity and Loss Tangent, Parallel Plate, 1MHz to 1.5 GHz
3 Test Specimens
3.1
All base materials specimens shall have the metallic foil layer removed by etching or other suitable means and shall be
thoroughly cleaned. Each specimen shall be marked in the upper left corner with an engraving pencil or equivalent.
3.2
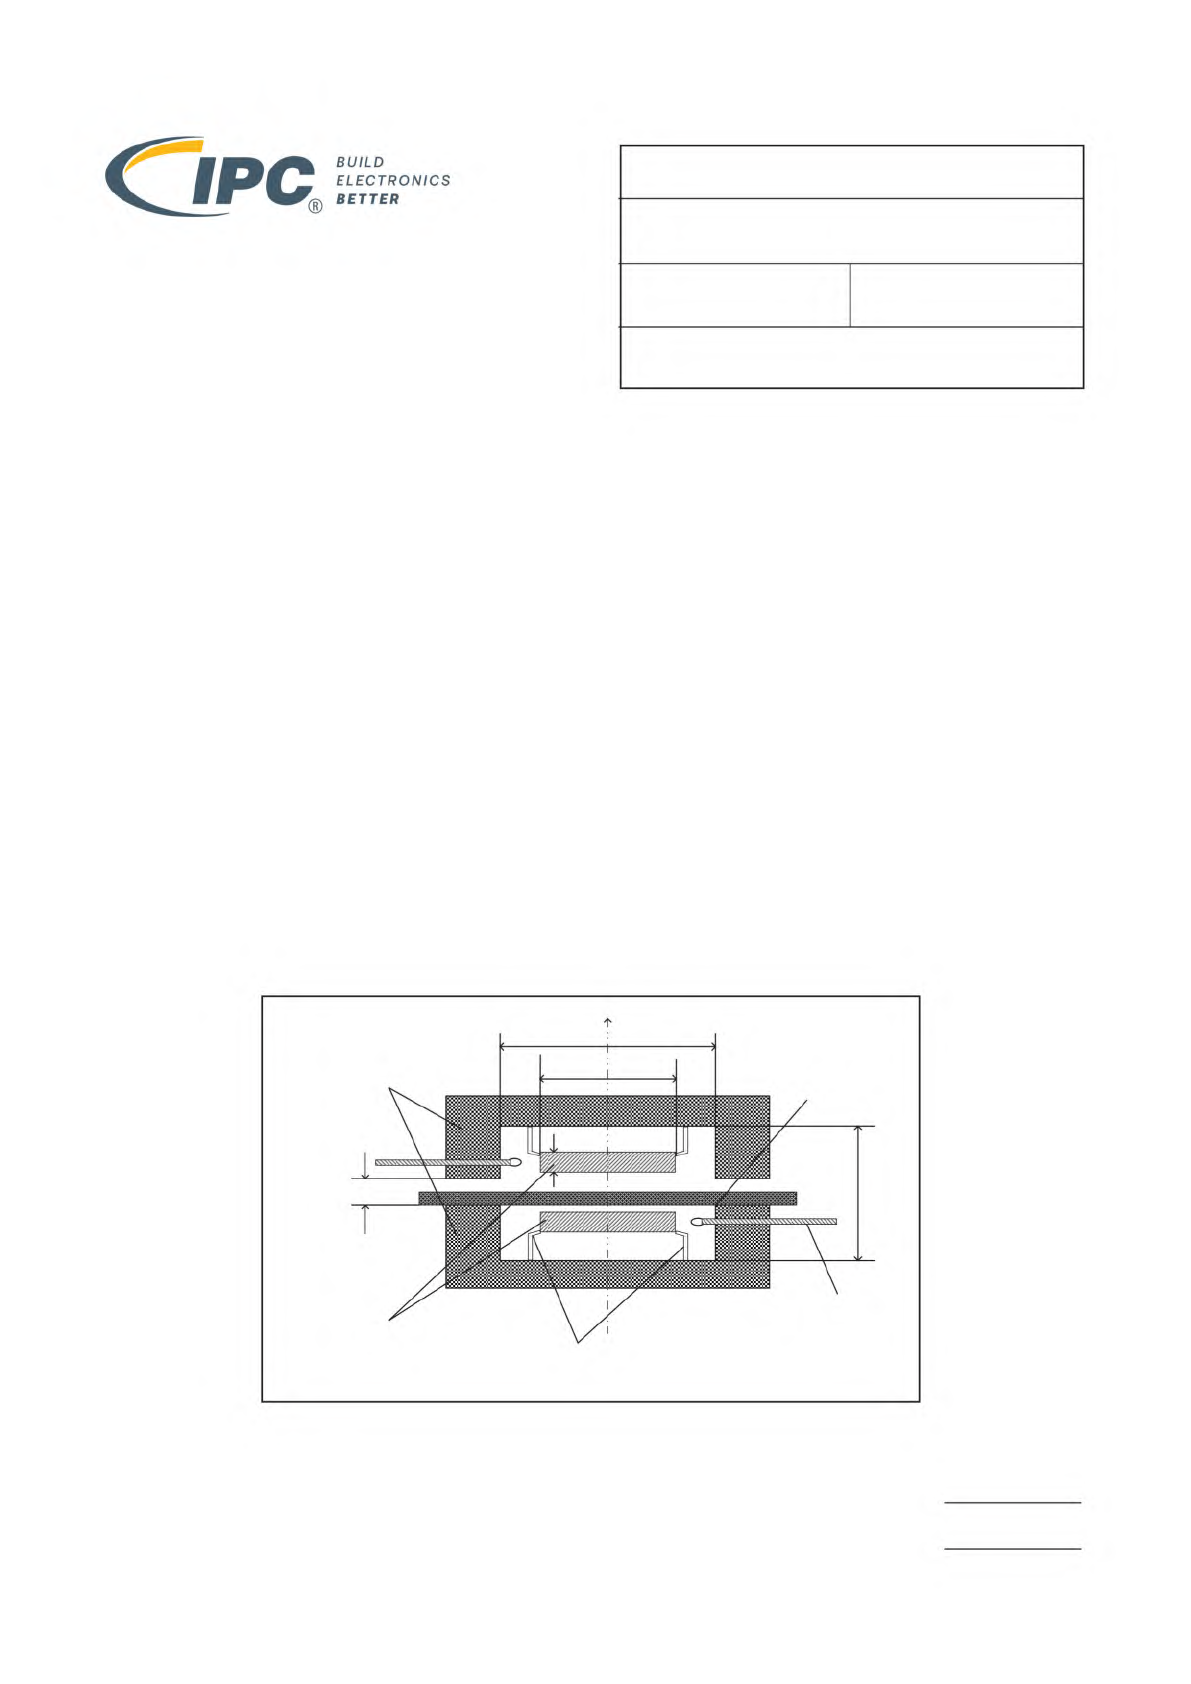
The dimensions of the test specimen shall be larger than the outer dimension of the fixture. See Figure 1.
The size of the specimen shall be larger than the internal diameter D of the metal enclosures, and the maximum thickness of the
specimen shall be smaller than the distance h
g
between the metal enclosures of the fixture.
support
coupling loop
metal enclosure
dielectric resonators
sample
D
h
g
z
h
r
L
dr
Figure1–DiagramofSPDRTestFixture
Page 1 of 7
2.5.5.15
06/22 N/A
3-11aIPC-4101TaskGroup
RelativePermittivityandLossTangentUsinga
Split-PostDielectricResonator
BUILD
ELECTRONICS
BETTER
个
1 Scope
This test method is used to quantify the deleteri-
ous effects of fabrication, process or handling residues on
Surface Insulation Resistance (SIR) in the presence of mois-
ture. The electrodes are long parallel traces (printed inter-
digitated comb patterns) on a standardized printed board or
assembly. Samples shall be conditioned and measurements
taken at a high humidity. Electrodes are electrically biased
during conditioning to facilitate electrochemical reactions.
Specifically, this method is designed to:
• Simultaneously assess
a) leakage current caused by ionized water films and
b) electrochemical degradation of test vehicle, (corrosion,
dendritic growth).
• Provide metric(s) that can appropriately be used for binary
classification (e.g., go/no go, pass/fail).
• Compare, rank or characterize materials and processes.
2 Applicable Documents
2.1 IPC
Surface Insulation Resistance - Gerber Kit
Requirements for Soldering Fluxes
Acceptability of Printed Boards
Surface Insulation Resistance Handbook
2.2 American Society for Testing and Materials (ASTM)
Standard Test Methods for DC Resistance or
Conductance of Insulating Materials
2.3 American National Standards Institute (ANSI)/NCSL
International
Calibration Laboratories and Measuring
and Test Equipment - General Requirements
American National Standard for
Expressing Uncertainty - U.S. Guide to the Expression of
Uncertainty in Measurement
2.4 International Electrotechnical Commission
Test methods for electrical materials, intercon-
nection structures and assemblies - Test methods for printed
board assemblies
3 Test Samples
The type and number of test samples
(coupons) as well as method of preparation and test require-
ments should be described in the governing specification
(e.g., J-STD-004) or procurement documentation.
If this test method is being used as a stand-alone document,
decisions should be made regarding what samples might be
the most appropriate for test. This SIR method should not be
considered standard unless standard test vehicles are used.
Vehicles prepared for flux qualification shall be handled in a
way that minimizes the possibility of ionic contamination. Use
of ion-free gloves and wrap/bags is required. If testing a pro-
cess, standard shipping and handling procedures shall be
used.
For further information about sampling and sampling sizes see
7.1 and 7.1.2.
The IPC-A-24-G-KIT artwork package provides the necessary
Gerber files for the fabrication of the standard IPC-B-24 test
board used with this test method.
3.1 Test Controls
Two cleaned bare IPC-B-24 test boards
(bare copper on FR-4) shall be used as chamber controls.
3.1.1
Visually inspect the boards for any obvious defects, as
described in IPC-A-600. If there is any doubt about the over-
all quality of any test sample, the board should be discarded.
3.1.2
Clean each control board by using deionized or dis-
tilled water and scrubbing with a soft bristle brush for a mini-
mum of 30 seconds. Spray rinse thoroughly with deionized or
distilled water. Rinse cleaned area thoroughly with virgin
2-propanol.
An alternative cleaning method is to place the test board in an
ionic contamination tester containing 75% 2-propanol, 25%
deionized water and process the solution until all ionics have
been removed.
1. www.ipc.org/onlinestore
3000 Lakeside Drive, Suite 309S
Bannockburn, IL 60015-1249
IPC-TM-650
TEST METHODS MANUAL
Number
2.6.3.7
Subject
Surface Insulation Resistance
Date
03/07
Revision
Originating Task Group
SIR Task Group (5-32b)
ASSOCIATION CONNECTING
ELECTRONICS INDUSTRIES
®
IEC-61189-5
IPC-A-24-G-KIT1
J-STD-004
IPC-A-600
IPC-9201
ASTM
D
257
ANSI/NCSL
Z540-1
ANSI/NCSL
Z540-2
Material
/n
this
Test
Methods
Manual
was
voluntarily
established
by
Technical
Committees
of
I
PC.
This
material
/s
advisory
only
and
"s
use
or
adaptation
,
s
entirely
voluntary.
IPC
disclaims
all
liability
of
any
kind
as
to
the
use,
application,
or
adaptation
of
this
material.
Users
are
also
wholly
responsible
for
protecting
themselves
against
all
claims
or
liabilities
for
patent
infringement.
Equipment
referenced
/s
for
the
convenience
of
the
user
and
does
not
imply
endorsement
by
IPC.
Page
1
of
4
During the remainder of the preparation, handle boards by the
edges only and use noncontaminating gloves.
3.1.3
Dry the cleaned boards for two hours at 50 °C.
3.1.4
If boards are to be stored before treatment, place the
boards in Kapak™ bags or other contamination-free contain-
ers (do not heat seal) in a desiccator. (Kapak™ bags are avail-
able from Fischer, VWR and other distributors.)
3.1.5
When measured as described in Sections 4 and 5, if
the control board readings are less than 1000 MΩ at any point
after the initial 24 hours of SIR exposure, a new set of test
coupons shall be obtained and the entire test repeated.
3.2 Blank Process Controls
If performing process valida-
tion testing, two samples from an unprocessed blank should
be run with the samples taken from the processed boards.
Values obtained from unprocessed board samples are useful
when failure is observed within the processed board sample.
Failure of the unprocessed samples may indicate a problem
with the incoming bare board rather than an assembly pro-
cess.
4 Equipment/Apparatus
It is the responsibility of the user
of this method to verify equipment suitability. This method
intends for all tolerances to be interpreted as uncertainties
with a confidence interval of 95% as referenced in ANSI/NCSL
Z540-1 and ANSI/NCSL Z540-2. Quantitative, qualitative and
default information follow in the paragraphs below.
4.1 Electrometer
Electrometer, High Resistance Meter,
Picoammeter or equivalent as described by ASTM D 257.
a) System must be capable of taking measurements and
controlling the switching automatically (unattended).
b) Minimum resistance measurement accuracy (not only
meter, but as implemented)
5% of full scale up to 10
10
Ω @ 5V
10% of full scale up to 10
11
Ω @ 5V
20% of full scale above 10
11
Ω @ 5V
c) Accuracy with respect to the ‘‘true’’ value requires assess-
ment of stability of the measurement system (after switch-
ing from bias voltage to the measurement voltage). There-
fore, if the system does not automatically assess stability
before logging, use an arbitrary time of one minute.
d) The system described in this section must be able to make
all measurements required within a 20 minute period and
meet the requirements of 5.3.
It is preferred that the resistance reading be stable before
acquiring the readings or data. If after one minute the signal
remains unstable, a measurement should still be recorded.
4.2 Switching System
a) Must have a channel-to-channel isolation resistance ten
times greater than the resistance of typical SIR require-
ments, or a default channel-to-channel isolation resistance
of 10
12
Ω.
b) <20-minute cycle while obtaining measurements as
described above.
c) Unique 10
6
Ω current limiting capability per channel.
4.3 Wire Attachments
a) Single solid copper wire with PTFE insulation.
b) Preferred solid wire solders (no flux), or nominally 1% by
weight rosin nonactivated. See wire attach section of this
document for more information.
c) Electrical (EMI) shielding to guard cabling from stray cur-
rents.
4.3.2 Alternative
Wire attachments such as stranded wire,
non-PTFE insulation, edge connectors rather than hard wiring,
and guarding techniques may be used provided the system
accuracy is not compromised.
4.4 Controlled Temperature and Humidity Chamber
a) Produce 40 ± 1 °C at 90 ± 3% R.H.
b) Continuous or semicontinuous recording of this environ-
ment. ± 2 °C and ± 3% R.H.
c) Samples should not significantly impede airflow.
d) Adequate mixing of water vapor and air is imperative to
ensure condensation does not occur anywhere in the
chamber except on/around cooling or dehumidification
coils. If any part of interior of the chamber is below the dew
point (possibly due to insulation or control issues), conden-
sation will occur. This is not necessarily a problem as long
as the samples are kept above the dew point and are
shielded from dripping or flying condensate.
4.5 Camera
Camera capable of recording color image.
5 Test Procedure
5.1 Interconnect Samples
Number
2.6.3.7
Subject
Surface Insulation Resistance
Date
03/07
Revision
IPC-TM-650
Page
2
of
4