IPC-TM-650 EN 2022 试验方法--.pdf - 第635页
• S ample ID • T emperature Coefficient of Resistance for each test tem- perature and ‘‘cell’’ • C ycles to fa il • A pplicable f ailure criteria • F ailure point (temperature at fail, hot or cold side of cycle) • F ailu…

computer controls the oven temperature through a range of
temperatures from 23 °C to 260 °C [73 to 500 °F]. The com-
puter monitors and records the equilibrium resistance for each
temperature. The equation used to calculate the TCR for each
tested coupon is as follows:
TCR(T) =
(Rh − Rrm)
(Th − Trm) x Rrm
where:
TCR(T) = Calculated TCR for the coupon as a function of
intended Method B Test Temperature T
Th = Temperature of coupon at oven temperature
Rh = Resistance of coupon at oven temperature
Rrm = Resistance of coupon at ambient temperature
Trm = Ambient Temperature (approximately 23 °C [73 °F])
5.3.4 Stress Cycle Definition
The system calculates and
displays the coupon test temperature with the following equa-
tion:
T = Trm +
(R − Rrm)
(Rrm x TCR(T))
where:
TCR(T) = Measured thermal coefficient of resistance for this
type/cell of coupons (see 5.3.3.1)
Rrm = Resistance of coupon at ambient temperature
measured at start of each cycle
T = Coupon test temperature calculated at 1 second
intervals
R = Coupon resistance measured at 1 second intervals
Trm = Ambient temperature measured at each cycle
(approximately 23 °C [73 °F])
Alternately, this equation may be expressed in terms of the
target resistance that is equivalent to the targeted high tem-
perature for that coupon and cycle, as follows:
Target Resistance = Rrm x (1 + TCR(Th)[Th - Trm])
where:
Th = Target high test temperature
5.3.5 Failure Threshold
Three different failure criteria or a
combination of these three may be used for a Method B cycle
as shown below. Refer to definitions for the variable names
and the equation for Target Resistance in 5.3.3.
1) R-high. During any single cycle, R exceeds target value by
more than R1% (default R1 = 5%) anytime during cycle,
that is,
R-high failure threshold: R > Target Resistance x (1 + R1).
2) R-low. During any single cycle, the final Rrm(n) after cool-
ing is greater than Rrm(n-1) of the previous cycle by more
than R2% (default R2 = 5%), that is
R-low failure threshold: Rrm(n) Rrm(n-1) x (1 + R2).
3) R-delta. Coupon is failed at cycle n if the final Rrm(n) after
cooling is equal to or greater than R3% (default R3=10%)
change from Rrm(0) at the start of test prior to cycle 1.
R-delta Failure Threshold: Rrm(n) > Rrm(0) x (1 + R3).
5.3.6 Stress Cycle Test Sequence
The following para-
graphs detail the sequence for a single coupon; however this
sequence is done at all test heads simultaneously.
5.3.6.1
Stress test coupons are placed in the table top test
fixture. The test fixture includes a cooling fan and quick con-
nect housings for the test coupons.
5.3.6.2
The Method B test system uses the TCR and asso-
ciated equation (see 5.3.3) to heat the coupon with DC cur-
rent (variable level determined in 1 second intervals) to the
prescribed ramp rate and high test temperature. The com-
puter also monitors and records the relative changes in resis-
tance of the plated barrel throughout the heating cycle.
5.3.6.3
The dwell time at test temperature is followed by
forced air cooling. Cooling time is a function of overall thick-
ness and construction of the coupon. The computer monitors
and records the coupon’s performance throughout the cool-
ing cycle.
5.3.6.4
The individual coupons are continually thermal
cycled using their customized heating and cooling conditions
until one of the rejection criteria is achieved or the maximum
number of cycles is completed.
5.3.6.5
The heating and cooling resistance data is compiled
for each coupon’s performance throughout the stress testing.
The system software provides a download file to graph the
coupon’s performance. Data is compiled to create graphs of
each coupon’s performance throughout stress testing.
5.3.7 Graphing and Data Analysis
5.3.7.1 Tabulation of Results
Test results are typically
reported with the following information:
• Test Coupon Description
• Test Parameters: Temperature(s), ramp rate, dwell
Number
2.6.26
Subject
DC Current Induced Thermal Cycling Test
Date
5/14
Revision
A
IPC-TM-650
Page
7
of
10
• Sample ID
• Temperature Coefficient of Resistance for each test tem-
perature and ‘‘cell’’
• Cycles to fail
• Applicable failure criteria
• Failure point (temperature at fail, hot or cold side of cycle)
• Failure isolation and analysis, if applicable
• Disposition of Test Results
6 Notes
6.1 Assembly Preconditioning – Optional
The elevated
temperatures of the lead free assembly process impacts the
performance of the plated barrels and internal connections.
Assembly preconditioning is recommended before the DC
current induced thermal cycling. When an individual coupon
delta reaches the rejection resistance, stress cycle testing is
stopped for the coupon.
6.1.1 Method A
The available equipment ranges and typi-
cal assembly preconditions are provided in Table 6-1. Attach
the power cable at the same location as the Method A stress
test.
6.1.2 Method B
The Method stress test temperatures are
based on the assembly process temperatures (see Table 5-2).
6.1.3 Convection Reflow Assembly Simulation (Method
C)
The assembly temperatures are based on IPC-TM-650,
Method 2.6.27.
6.2 Microsection Evaluation – Optional
If detailed failure
analysis is desired to determine the exact location of separa-
tions and/or cracks, select an appropriate number of coupons
for failure analysis. Locate the failure location and microsec-
tion to determine the most likely cause of the failure. Micro-
section of failed coupons be performed in accordance
with IPC-TM-650, Method 2.1.1.
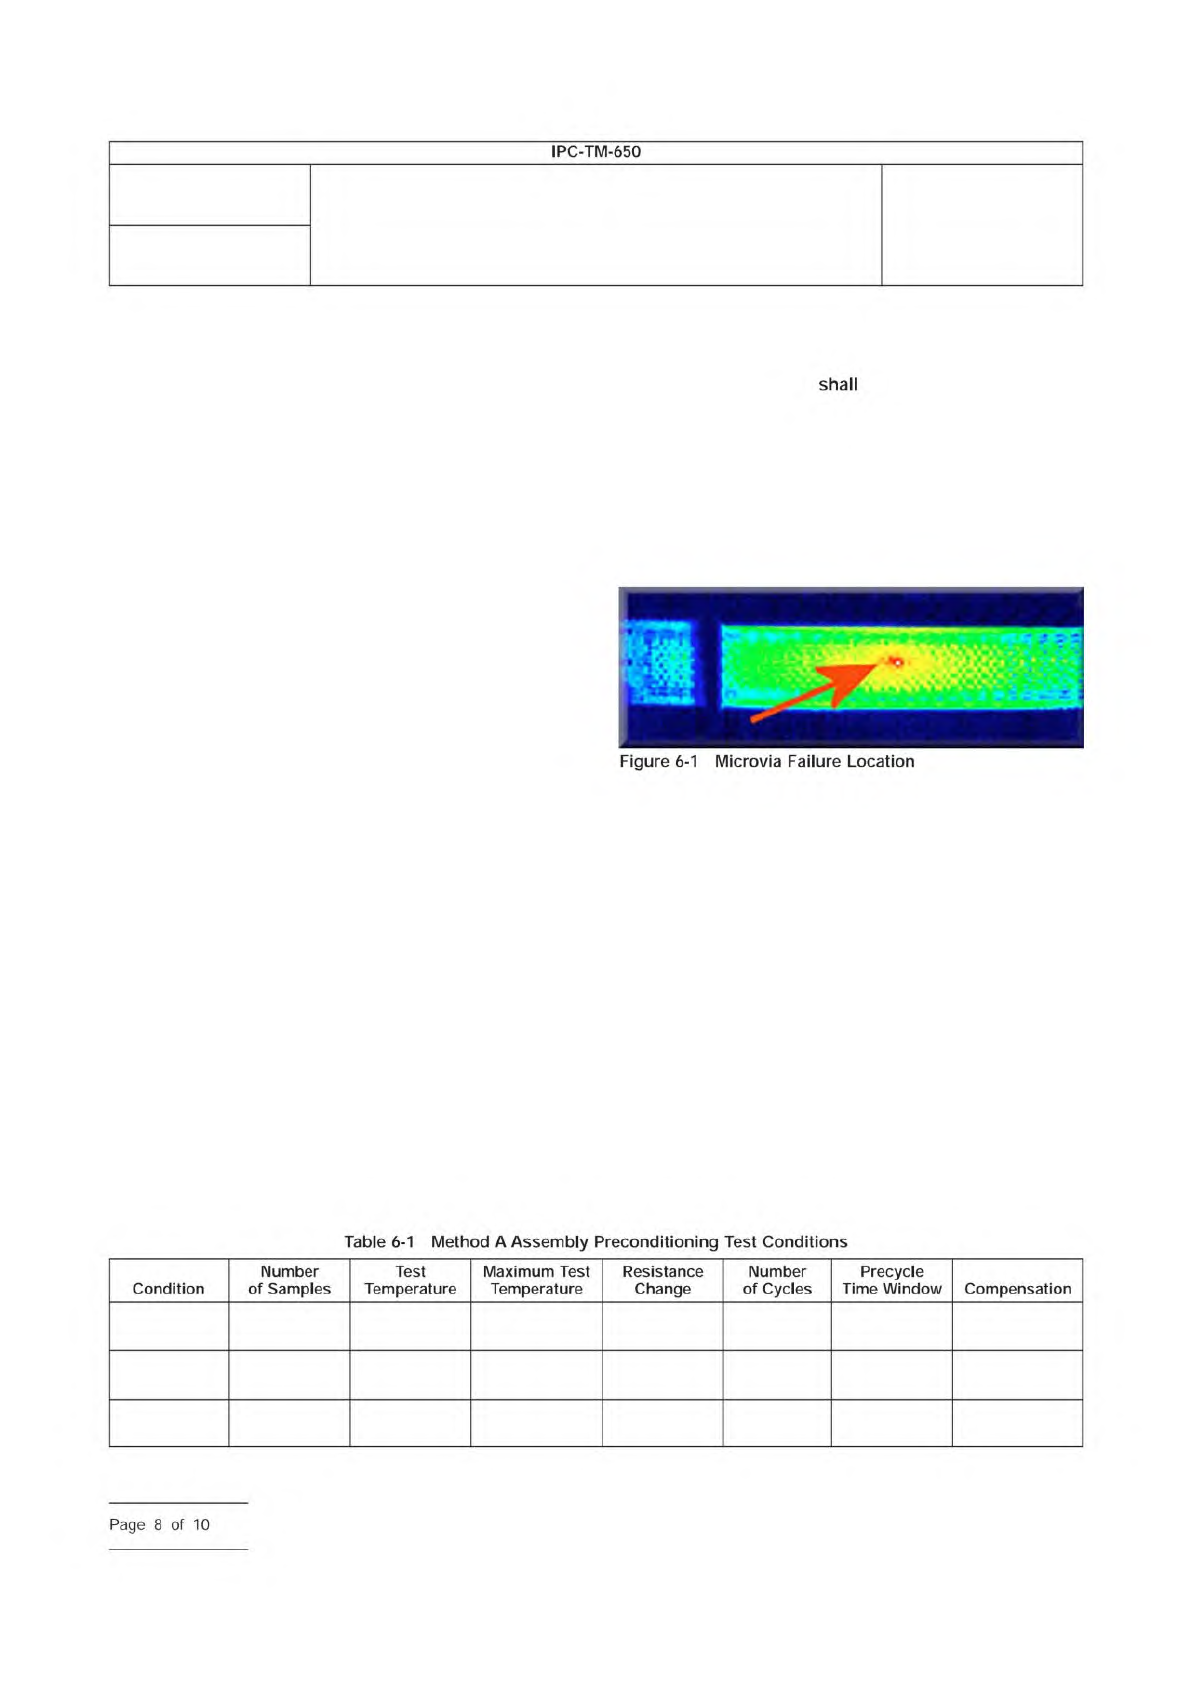
6.2.1 Locate Failure by Thermal Camera
Locate the fail-
ure by applying a small current to the failing circuit and
observe the thermal camera output (see Figure 6-1). The loca-
tion with the ’hottest’ thermal signature is selected for failure
analysis.
6.2.2 Locate Failure by Hot Plate
Locate the failure using
a hot plate set at 220 - 250 °C. The hot plate should be cov-
ered with Kapton tape or a similar electrical insulator to insu-
late the coupon from the hot plate surface. Place the coupon
on the hot plate and monitor the resistance change using a
4-wire multimeter. The location with the highest resistance or
open is selected for failure analysis.
6.2.3 Locate Failure by Resistance
Locate the failure
using a 4-wire multimeter. Electrical isolate the circuits, PTHs,
or conductors by cutting conductors. The location with a high
resistance or open is selected for failure analysis.
6.3 Methods Overview
Table 6-2 provides an overview of
the two methods described in this test method to measure
the change of resistance of plated barrels and/or internal con-
nections as they are subjected to thermal cycling.
Tin/Lead
Reflow
6
230°C
[446°F]
240°C
[464°F]
10% 6 5 seconds None
Lead Free
Reflow A
6
245°C
[473°F]
255°C
[491°F]
10% 6 5 seconds None
Lead Free
Reflow B
6
260°C
[500°F]
270°C
[518°F]
10% 6 5 seconds None
Number
2.6.26
Subject
DC Current Induced Thermal Cycling Test
Date
5/14
Revision
A
IPC-TM-650
shall
Figure
6-1
Microvia
Failure
Location
Table
6-1
Method
A
Assembly
Preconditioning
Test
Conditions
Condition
Number
of
Samples
Test
Temperature
Maximum
Test
Temperature
Resistance
Change
Number
of
Cycles
Precycle
Time
Window
Compensation
Page
8
of
10

6.4 Optional Testing
Instances of optional testing
throughout this test method represent tests that have not
been validated in accordance with IPC-MDP-650.
6.5 Validation Testing
Validation of test machines refer-
enced in 4.1 and 4.2
test the following key aspects of
the test method. The TCR is used to associate resistance val-
ues to the test temperature, and the designated test
temperature/resistance at the beginning of the thermal cycling
test. These validation activities
be done at 2 or more
independent test sites that use the test machine. The testing
is assessing that there is no statistical difference between
independent test machines at a 95% confidence limit on a
minimum of 16 test coupons.
6.5.1 Method A
6.5.1.1 Temperature Coefficient of Resistance (TCR)
Validation
1. Verify the equipment is calibrated and ready for use.
2. Load coupons into all the test heads on the test machine
3. Record the resistance of the each coupon at 150 °C on the
Sense net.
4. Remove the coupons from the test equipment and attach
wires to the (4) header pins on the Sense net.
5. Attach thermocouple wires to the laminate surface of each
coupon.
6. Place coupons in an oven set at 150 °C.
DC Current Applied To Plated Structure, Conductor, Land and Internal Connections
Temperature Coefficient
of Resistance (TCR)
Estimated Measured
Assembly Preconditioning
1
3 minute to temperature
230 °C for tin-lead
245 °C for low temperature lead-free
260 °C for high temperature lead-free
Or alternate assembly preconditioning method,
such as per IPC-TM-650, Method 2.6.27
3 or 5 °C per second to temperature
220 °C for eutectic tin-lead assembly
245 or 260 °C for lead-free assembly
Test Temperature
150 °C for standard FR4
170 °C for standard polyimide
190 °C for microvias on standard FR4
210 °C for microvias on Polyimide
230 °C for Survivability tin-lead
245 or 260 °C for Survivability lead-free
220 °C for eutectic tin/lead assembly
245 °C for lead-free assembly
Heating Rate or Time
3 minutes maximum
Variable based on application
3 or 5 °C per second
Dwell time at
maximum temperature
1 second
Variable based on application
40 seconds
Failure Threshold
10% increase in resistance over
resistance at test temperature
For each cycle, 5% change in
resistance for R
High
or R
Low
10% increase in resistance over
resistance at ambient temperature
Cooling Method Forced ambient air Forced ambient air
Resistance Monitored Continuous Continuous
When testing at reflow temperature, assembly preconditioning and test temperature may be combined.
Number
2.6.26
Subject
DC Current Induced Thermal Cycling Test
Date
5/14
Revision
A
IPC-TM-650
—
Table
6-2
Methods
Overview
Note
1.
Method
A
Method
B
—
Page
9
of
10