IPC-TM-650 EN 2022 试验方法--.pdf - 第76页
IPC-TM-650 Number Subject Date Revision Page 2 of 2 2.2.4 Dimensional Stability, Flexible Dielectric Materials 5/98 C Twenty-four hour stabilization is referee method. 5.2 Method A Dimensional stability of unclad materia…
NOTE:
NOTE:
NOTE:
IPC-TM-650
Number
Subject Date
Revision
Page 3 of 4
2.2.13.1
Thickness,
Plating
in
Holes
Microhm
Method
1/83
A
4
steady
reading
indicates
that
the
probes
am
mak¬
ing
good
contact.
Trial
settings
to
obtain
the
minimum
resis¬
tance
value
will
indicate
when
the
probes
are
properly
located
over
the
interconnection.
5.2.5
If
poor
electrical
contact
is
evidenced,
relocate
the
probes
until
a
minimum
resistance
is
indicated.
During
the
microscopic
inspection
(30X)
of
the
edges
of
the
plated-through
hole
and
the
adjacent
areas
on
the
ter¬
minal
area,
there
shall
be
no
detectable
damage
to
the
sur¬
faces
by
contact
with
the
probes
during
testing.
In
the
absence
of
such
surface
defects,
the
microhm
testing
can
assuredly
be
considered
nondestructive.
5.2.6
Read
and
record
the
microhm
value.
5.2.7
Compare
the
microhm
value
with
the
plating
thickness
of
the
standardization
curve
as
illustrated
in
Fig.
3.
The
theo¬
retical
curves
shown
in
Fig.
3
indicate
to
within
0.2-rail
thick¬
ness
the
plating
in
the
through
connection
and
for
all
practical
purposes
are
representative
of
the
resistance-
plating
thick¬
ness
relationships
encountered
in
practice.
This
comparison
shall
indicate
if
the
plating
thickness
of
the
through
connection
meets
the
acceptable
thickness
requirements
5.2.8
When
this
method
is
used,
any
reading
above
the
specified
allowable
microhm
reading
shall
be
reason
for
fur¬
ther
investigation
of
the
defect
for
conformance
to
the
require¬
ments
of
the
applicable
fabrication
specification.
5.2.9
Plating
thickness
curves
shall
be
generated
by
the
user.
6.0
Resistance
Curves
6.1
Curves
for
the
resistances
of
plated-through
holes
of
three
different
diameters
in
1/16"
printed
wiring
boards
are
presented
in
this
test
method
(Fig.
3).
Over
coatings
of
gold,
tin-lead,
etc.,
can
have
an
effect
on
the
micro-ohm
readings
depending
on
the
electrical
resistance
relative
to
the
copper.
Resistivity
of
tin-lead
is
approximately
ten
times
that
of
cop¬
per,
while
gold
is
of
the
same
resistivity.
6.2
To
eliminate
material
and
equipment
variables,
the
user
should
develop
thickness-resistance
curves
for
his
particular
condition
based
on
metallographic
cross-section
measure¬
ments
(TM-650
Method
2.2.13).
These
curves
may
be
used
as
guides
for
acceptance
of
product.
IPC-TM-650
Number
Subject Date
Revision
Page 2 of 2
2.2.4
Dimensional
Stability,
Flexible
Dielectric
Materials
5/98
C
Twenty-four
hour
stabilization
is
referee
method.
5.2
Method
A
Dimensional
stability
of
unclad
material
due
to
thermal
exposure
—
standard
condition.
(1)
Place
test
specimen
unconstrained
in
an
oven
maintained
at
150℃
±
2
℃
for
30
±
2
minutes.
(2)
Cool
specimen
to
standard
conditions
of
23℃
±
2
℃
and
50%
±
5%
RH
for
24
hours
minimum
(see
5).
(3)
Remeasure
separation
of
holes/lines
and
record
as
final
measurement
after
thermal
exposure
(F).
5.3
Method
B
Dimensional
stability
of
metal
clad
dielectrics
due
to
metal
removal.
(1)
Chemically
erode
the
metal
away
except
for
the
target
areas,
which
can
have
up
to
13
mm
x
13
mm
square
metal,
using
an
etchant
that
has
no
detrimental
effect
on
either
the
dielectric
or
adhesive.
Wash
and
dry.
The
test
specimen
should
be
unconstrained
during
the
etching,
washing,
and
drying
operation.
(2)
Stabilize
test
specimen
for
24
hours
at
23℃
±
2
℃
and
50%
±
5%
RH
(see
5.1).
(3)
Remeasure
separation
of
holes/lines
and
record
as
final
measurement
after
etching
(F2).
5.4
Method
C
Dimensional
stability
of
dielectric
due
to
thermal
exposure
and
metal
removal,
using
specimens
from
Method
B.
Place
unconstrained
etched,
conditioned,
and
measured
specimen
from
Method
B
in
an
oven
maintained
at
150℃
土
2
℃
for
30
±
2
minutes.
(2)
Stabilize
specimen
at
23℃
±
2
℃
and
50%
±
5%
RH
for
24
hours
and
remeasure
separation
of
holes
(see
5.1).
(3)
Remeasure
separation
of
holes/lines
and
record
as
final
after
etching
and
thermal
exposure
(F3).
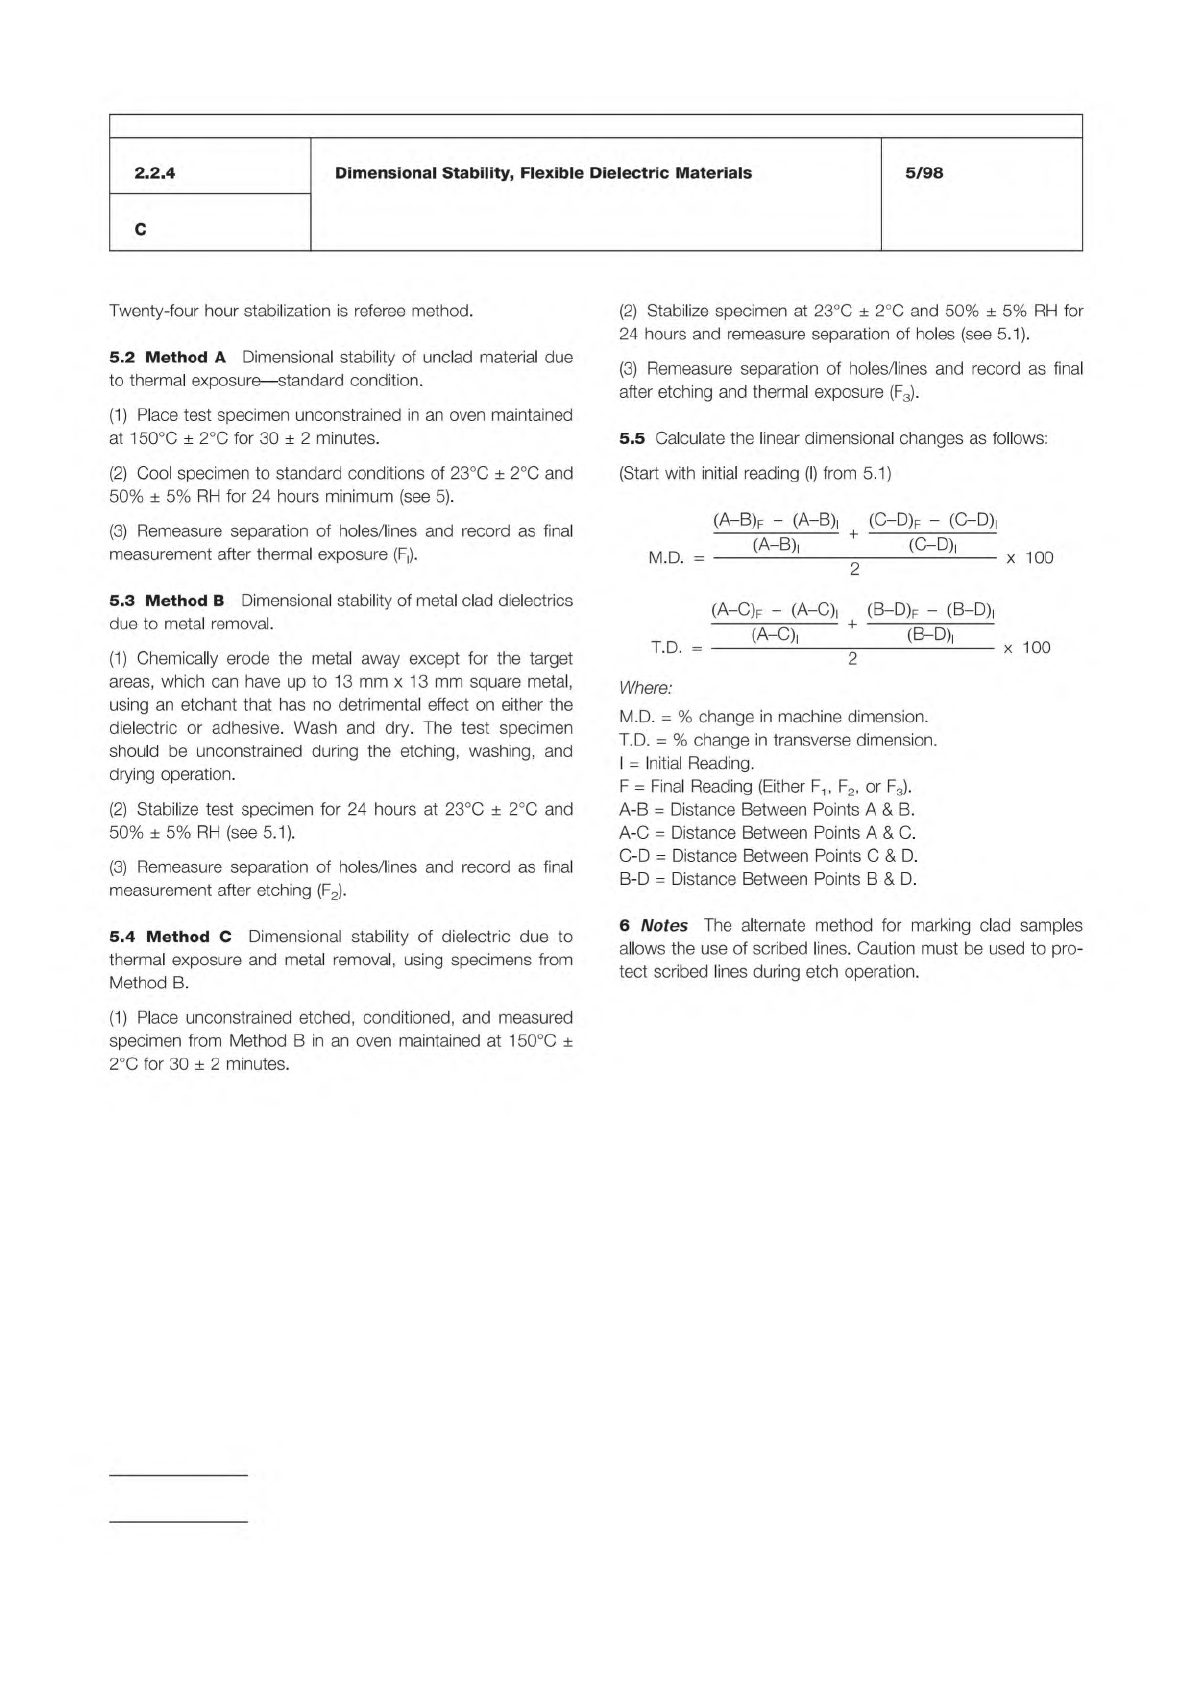
5.5
Calculate
the
linear
dimensional
changes
as
follows:
(Start
with
initial
reading
(I)
from
5.1)
(A—B)f
-
(A-B)|
(O-D)F
-
(C-D)|
,八
c、
+
e
c、
(A-C)f
-
(
A-C)|
(B-D)f
-
(
B-D)|
(A-C)|
*
(B-D)!
I
.U.
—
2
Where:
M.D.
=
%
change
in
machine
dimension.
T.D.
=
%
change
in
transverse
dimension.
I
=
Initial
Reading.
F
二
Final
Reading
(Either
F1
,
F2,
or
F3).
A-B
=
Distance
Between
Points
A
&
B.
A-C
=
Distance
Between
Points
A
&
C.
C-D
=
Distance
Between
Points
C
&
D.
B-D
=
Distance
Between
Points
B
&
D.
6
Notes
The
alternate
method
for
marking
clad
samples
allows
the
use
of
scribed
lines.
Caution
must
be
used
to
pro¬
tect
scribed
lines
during
etch
operation.
x
100
x
100
ASTM E11
BS.410
DIN 4188
ISO 565
ISO 3310
Table 1 Screen Opening
Type 1 150 75 20
Type 2 75 45 20
Type 3 45 25 20
Type 4 38 20
The Institute for Interconnecting and Packaging Electronic Circuits
2215 Sanders Road • Northbrook, IL 60062
Material in this Test Methods Manual was voluntarily established by Technical Committees of the IPC. This material is advisory only
and its use or adaptation is entirely voluntary. IPC disclaims all liability of any kind as to the use, application, or adaptation of this
material. Users are also wholly responsible for protecting themselves against all claims or liabilities for patent infringement.
Equipment referenced is for the convenience of the user and does not imply endorsement by the IPC.
Page 1 of 2
IPC-TM-650
TEST
METHODS
MANUAL
1
.0
Scope
A
method
for
determining
whether
or
not
the
powder
in
a
solder
paste
complies
with
the
relevant
powder
type.
The
ASTM
B-214
standard
screen
powder
size
distribu¬
tion
method
has
been
found
to
be
acceptable.
2
.0
Applicable
Documents
3
.0
Test
Specimen
Approximately
1
50
grams
of
solder
paste
4
.0
Equipment/Apparatus
Vibratory
test
sieving
machine
Test
sieves
to
BS.410,
ASTM
El
1
,
DIN
4188,
or
ISO
565
and
ISO
3310
with
mesh
openings
of
150,
75,
45,
38,
25
and
20
micrometers
Sieve
bottom
receiver
and
lid
Balance
(scale)
with
an
accuracy
of
0.01
g
Beaker
400-600
ml
Watch
glass
Solvent
Acetone
Spatula
5
.0
Procedure
5.1
Preparation
5.1.1
Wait,
if
necessary,
until
the
solder
paste
is
at
room
temperature.
5.2
Test
Number
2.2.14
Subject
Solder
Powder
Particle
Size
Distribution
—
Screen
Method
for
Types
1-4
Date
Revision
1/95
Originating
Task
Group
Solder
Paste
Task
Group
(5-24b)
5.2.2
Weigh
paste
containing
approximately
11
0
g
of
solder
alloy
into
the
carefully
cleaned
beaker.
5.2.3
Add
approximately
50
ml
solvent.
5.2.4
Stir
the
mixture
with
the
spatula
so
that
the
flux
in
the
paste
can
dissolve
in
the
solvent.
5.2.5
Cover
the
beaker
with
the
watch
glass.
5.2.6
Let
the
beaker
with
the
watch
glass
stand
until
the
solder
powder
settles.
5.2.7
Decant,
carefully,
as
much
as
possible
of
the
fluid
without
losing
any
of
the
solder
powder.
5.2.8
Repeat
the
extraction
procedure
five
times,
using
50
ml
solvent
for
each
extraction.
5.2.9
Add
approximately
50
ml
acetone
to
the
washed
sol¬
der
powder
and
stir
with
the
spatula
to
assist
in
drying.
5.2.10
Let
the
solder
powder
settle.
5.2.1
1
Decant,
carefully,
as
much
as
possible
of
the
acetone.
5.2.12
Repeat
the
acetone
wash
2
additional
times.
5.2.13
Allow
the
powder
to
dry
at
ambient
temperature
until
the
weight
is
constant.
5.2.14
Weigh
test
sieves,
with
mesh
opening
sizes
appro¬
priate
for
the
type
of
powder
being
tested,
and
the
sieve
bot¬
tom
receiver.
Typical
sieves
required
are
shown
in
Table
1
.
5.2.1
Homogenize
the
paste
by
stirring
with
the
spatula.