IPC-TM-650 EN 2022 试验方法--.pdf - 第772页
t1 198 ± 15 – Target pre heat time t2 254 ± 10 – Target peak r eflow time t3 311 ± 15 – Target cool-d own start ti me t3 - t 1 113 ± 30 – Target time above T1 T1 – 217 Maximum preheat temperature T2 – 245 ± 5 Ta rget ref…
IPC-2627-5-2
Number
2.6.27
Subject
Thermal Stress, Convection Reflow Assembly Simulation
Date
2/2020
Revision
B
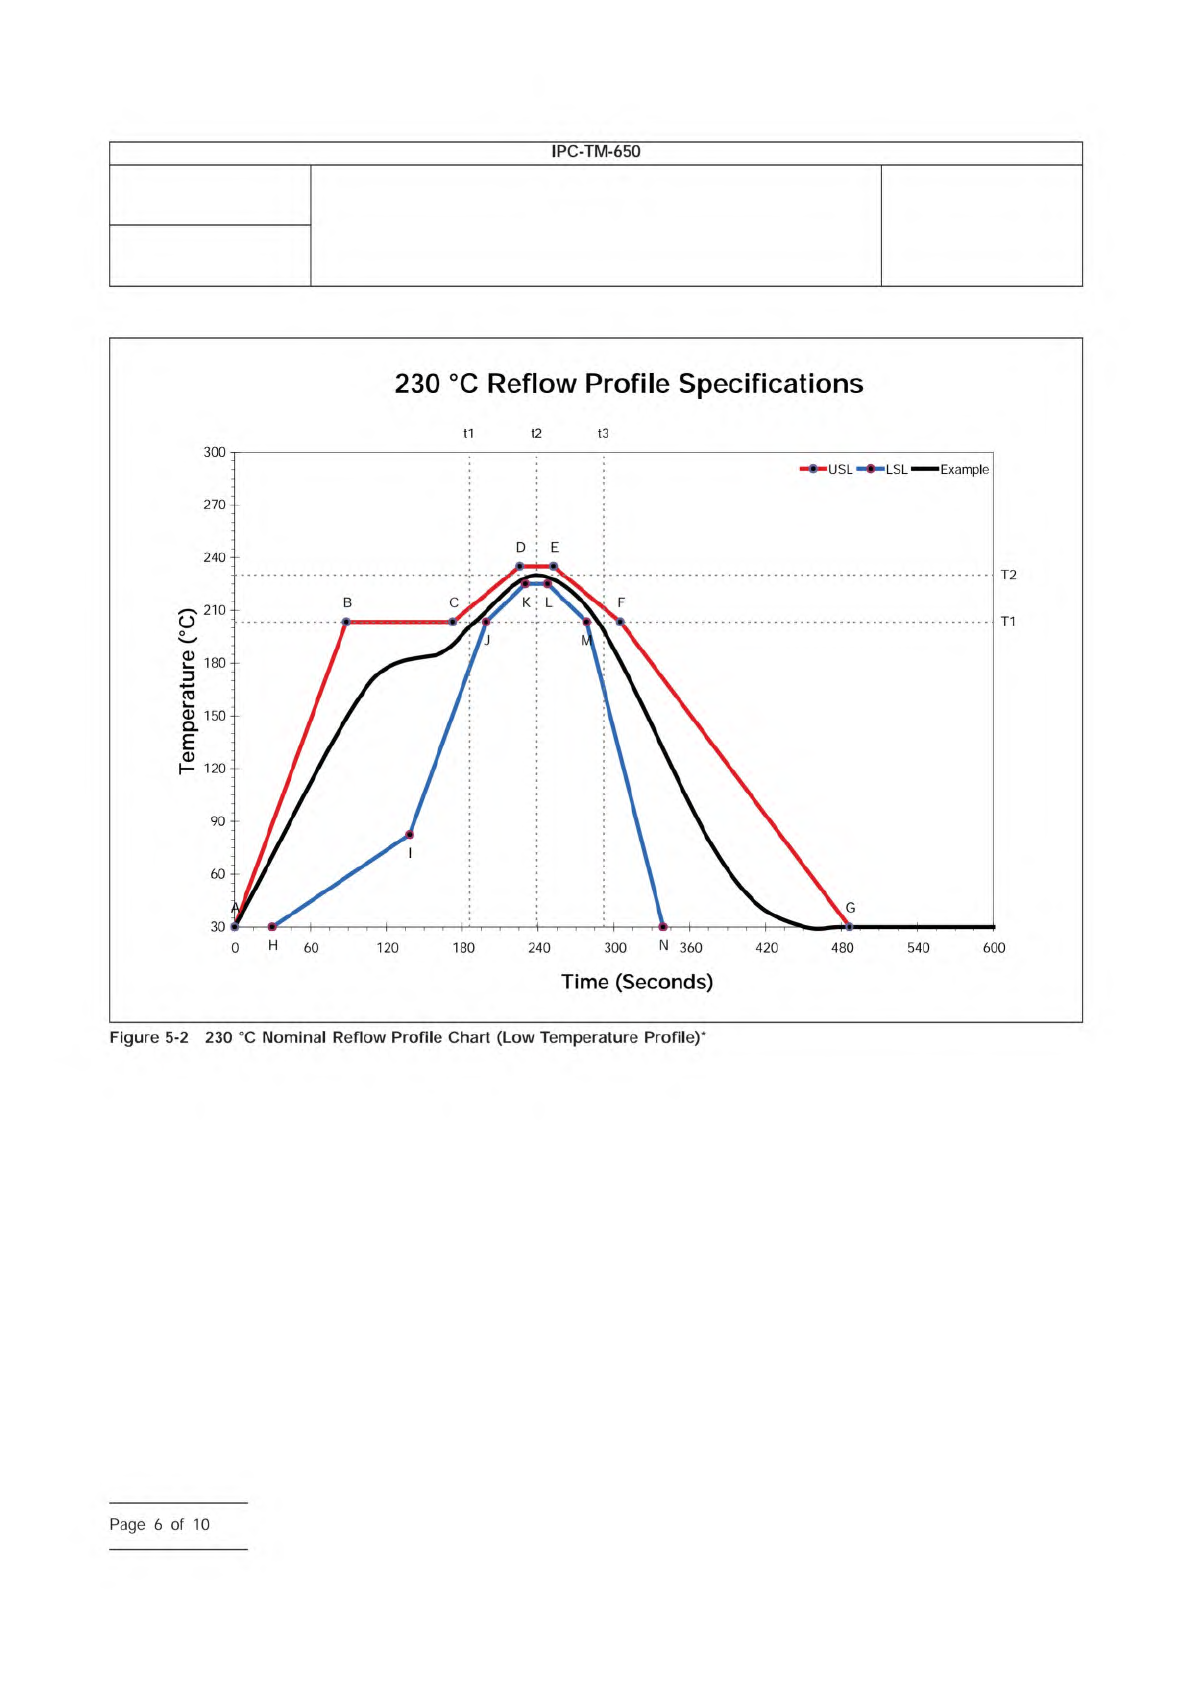
230
Reflow
Profile
Specifications
Figure
5-2
230
Nominal
Reflow
Profile
Chart
(Low
Temperature
Profile)*
IPC-TM-650
—
(9)
dE
Page
6
of
10
t1 198 ± 15 – Target preheat time
t2 254 ± 10 – Target peak reflow time
t3 311 ± 15 – Target cool-down start time
t3 - t1 113 ± 30 – Target time above T1
T1 – 217 Maximum preheat temperature
T2 – 245 ± 5 Target reflow temperature
A 0 30
Upper specification limit values
B 94 217
C 184 217
D 240 250
E 269 250
F 325 217
G 518 30
H 30 30
Lower specification limit values
I 148 88
J 212 217
K 245 240
L 264 240
M 297 217
N 361 30
A-B & I-J 2.0 Maximum preheat rate
H-I 0.5 Minimum preheat rate
F-G -1.0 Minimum cool-down rate
M-N -3.0 Maximum cool-down rate
Number
2.6.27
Subject
Thermal Stress, Convection Reflow Assembly Simulation
Date
2/2020
Revision
B
IPC-TM-650
―
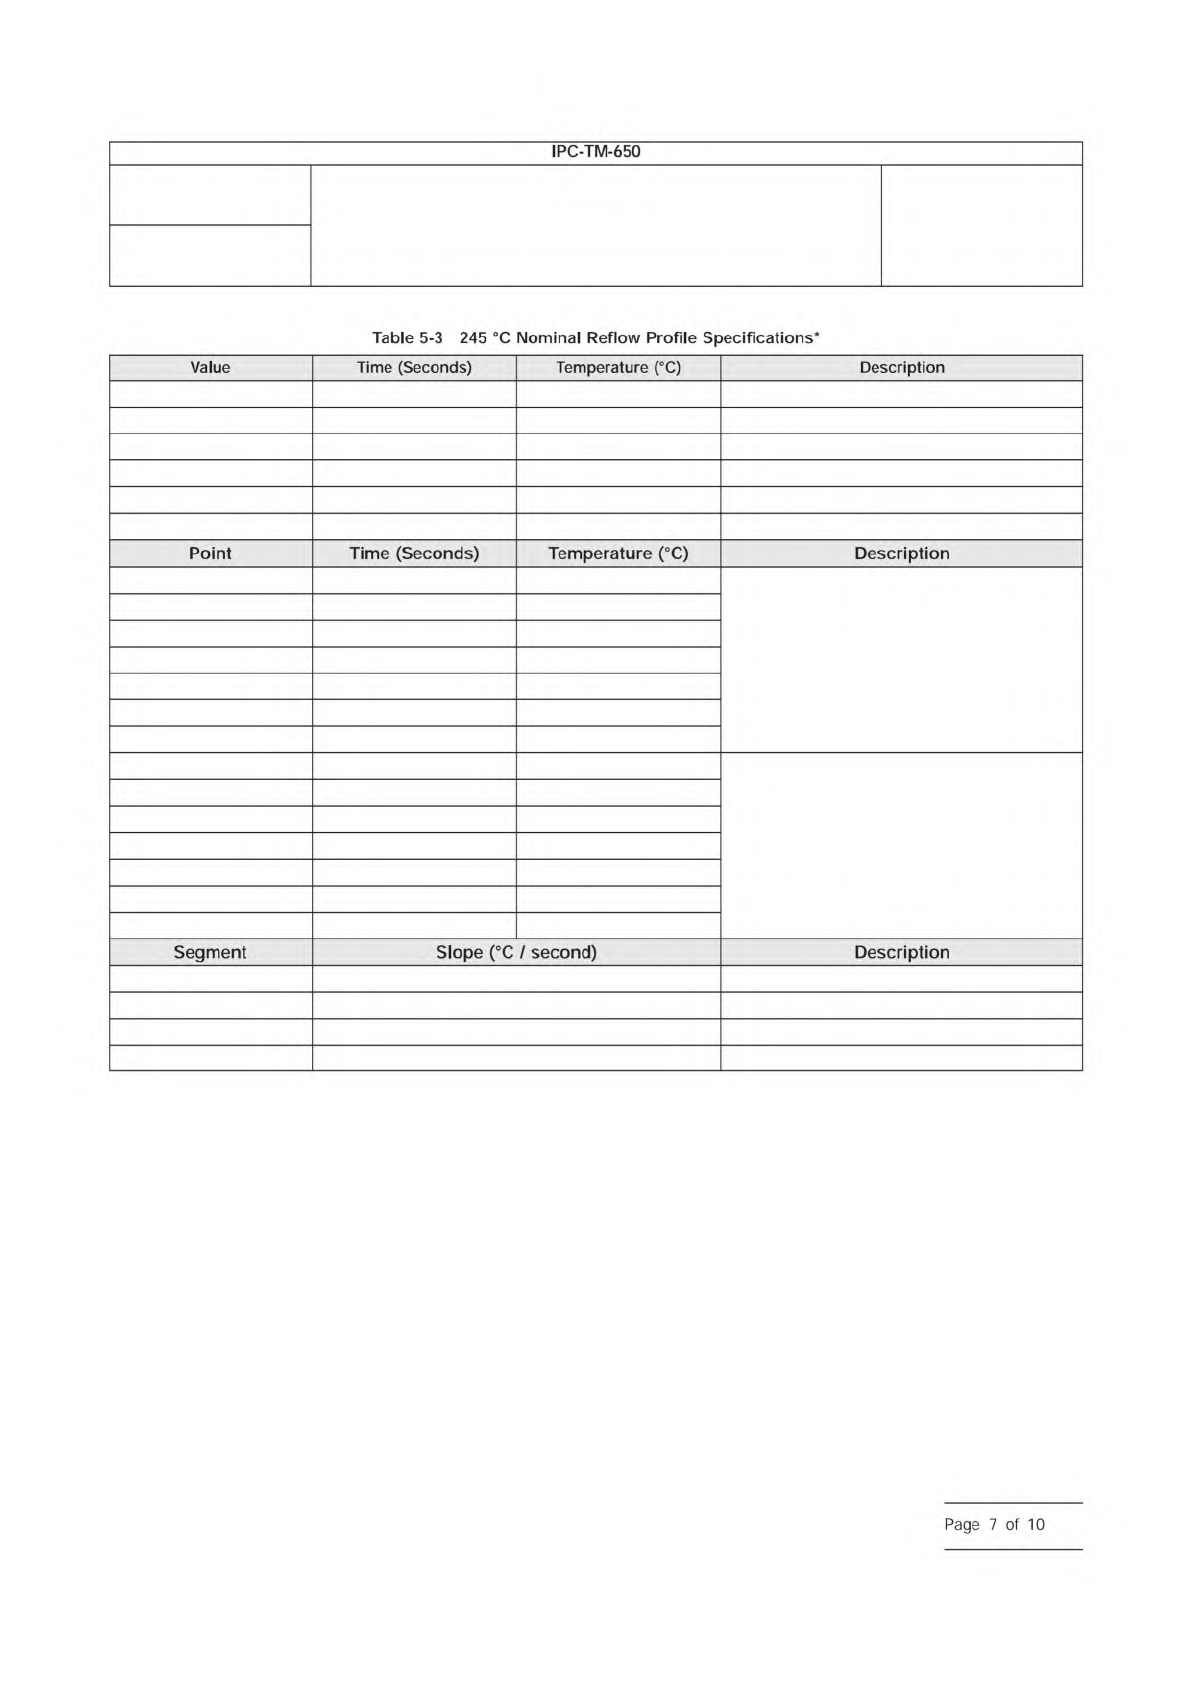
Table
5-3
245
Nominal
Reflow
Profile
Specifications*
Value
Time
(Seconds)
Temperature
(
℃)
Description
Point
Time
(Seconds)
Temperature
(
℃)
Description
Segment
Slope
(
℃
/
second)
Description
Page
7
of
10
IPC-2627-5-3
* The times to t1, t2 and t3 may vary based on the mass of the sample test specimen.
Number
2.6.27
Subject
Thermal Stress, Convection Reflow Assembly Simulation
Date
2/2020
Revision
B
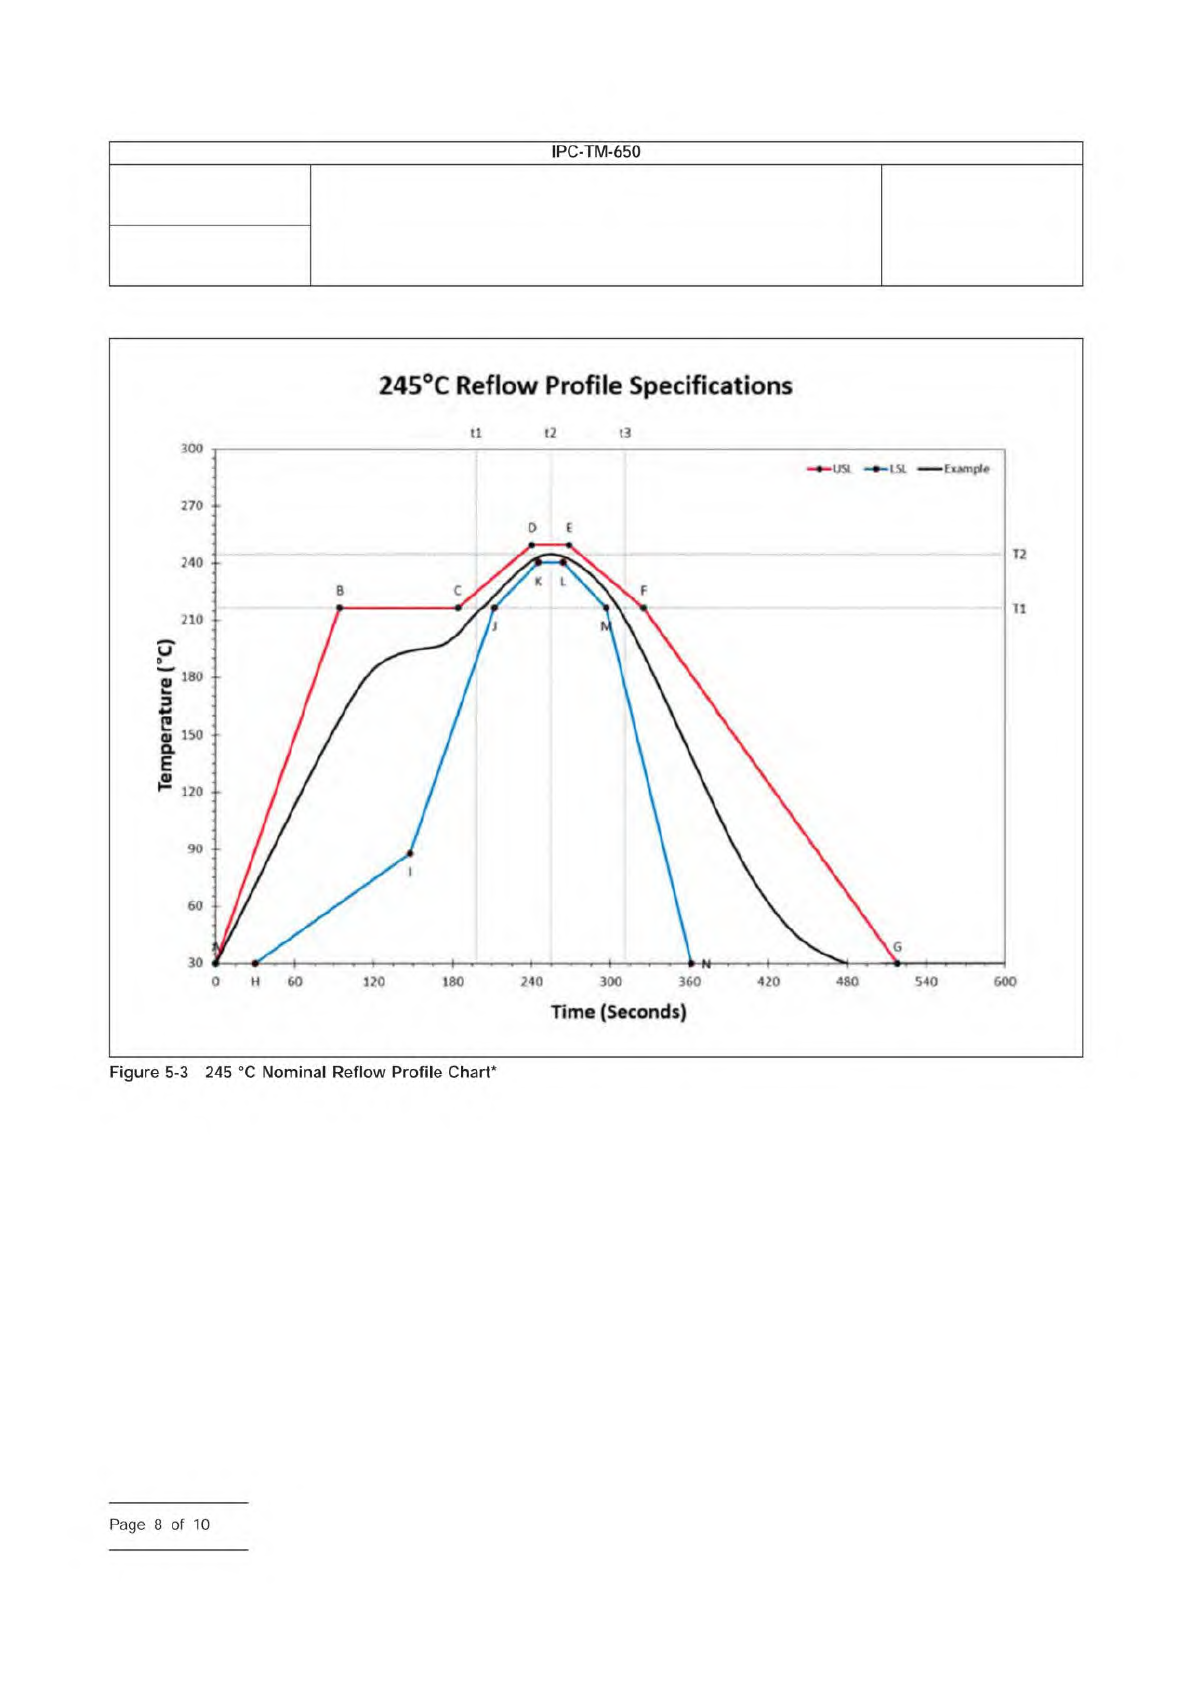
245
C
Reflow
Profile
Specifications
Time
(Seconds)
Figure
5-3
245
Nominal
Reflow
Profile
Chart*
IPC-TM-650
—
H
30
o
o
o
o
o
o
7
4
18b
29
2
2
2
1
1
1
W
L
Page
8
of
10