IPC-TM-650 EN 2022 试验方法--.pdf - 第804页
Figure 3 Vibration T es t Curves IPC-TM-650 Page 4 of 6 .0001 .00005 - .00001 10 L000 2,000 10.000 VIBRATION FREQUENCY (CPS) Number 3.12 Subject Vibration, Connectors Date 7/75 Revision A 1 00 ^§5^ &mno £ wwldwv NOUV…
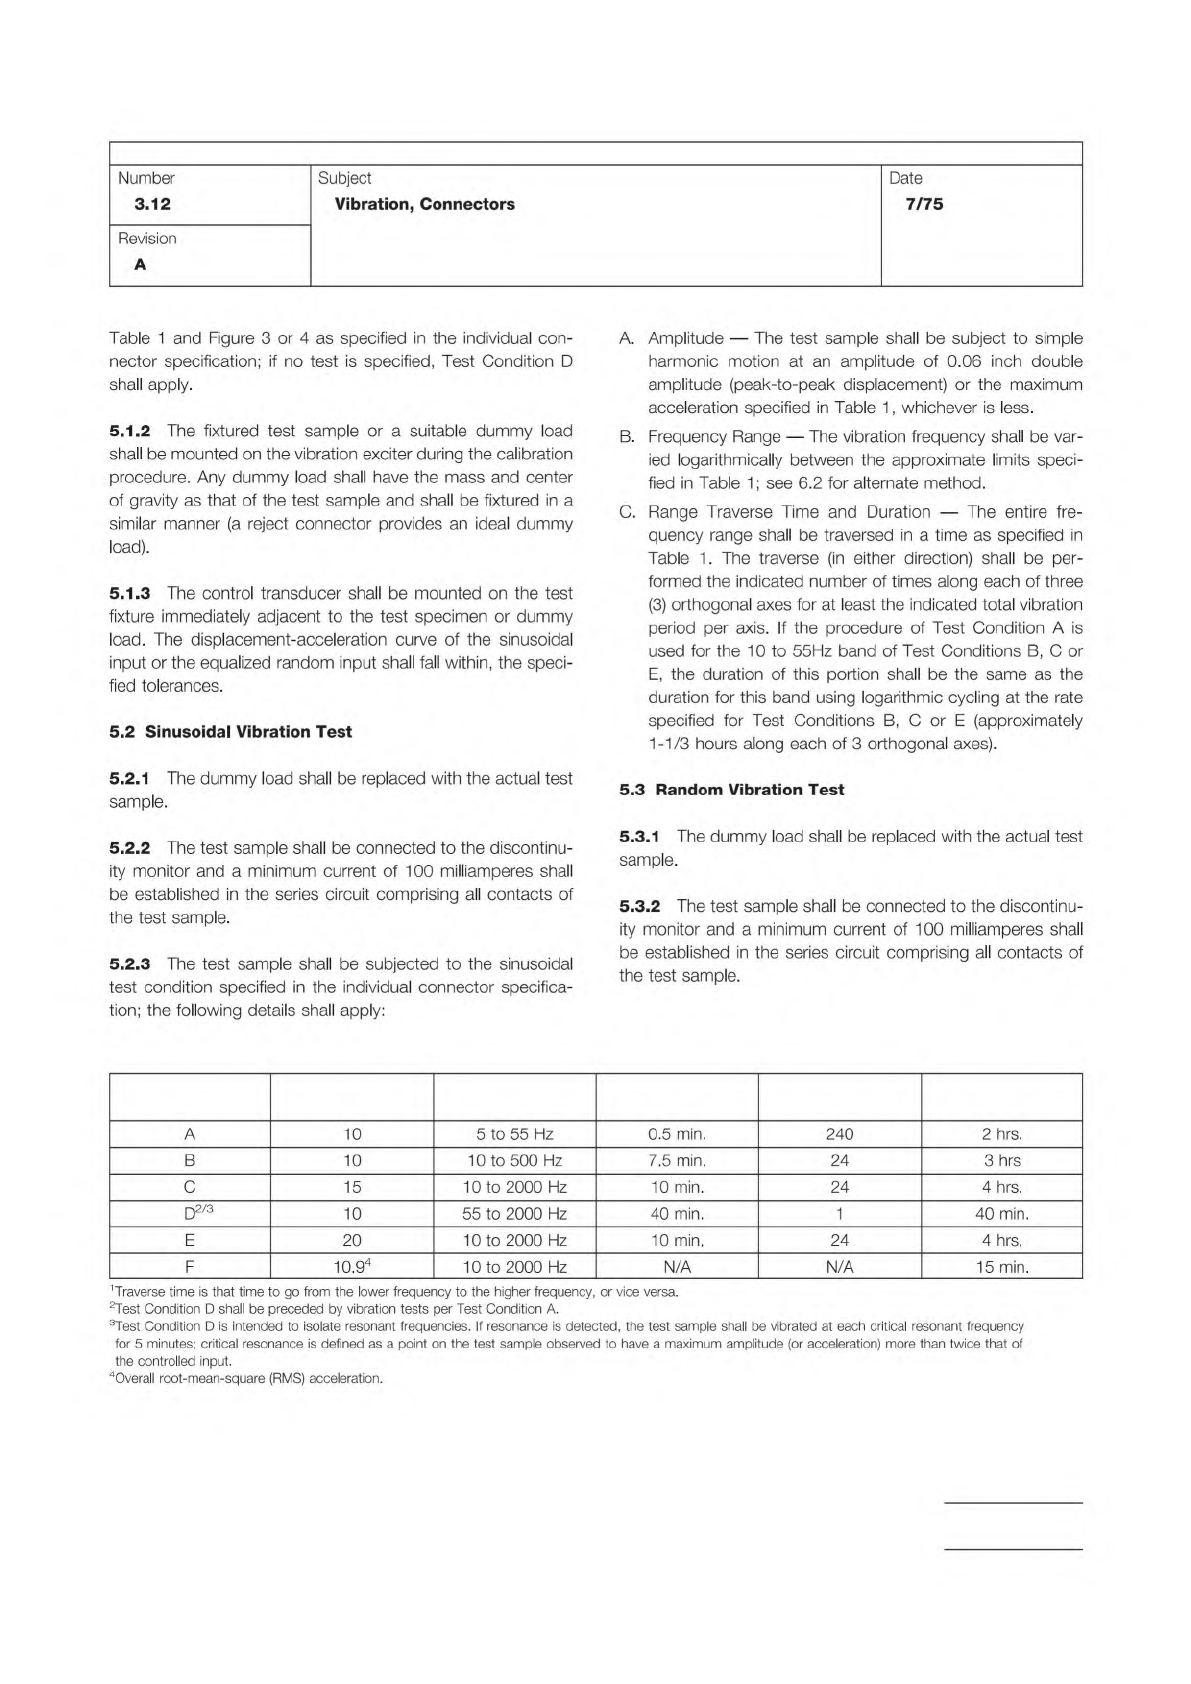
Table 1 Test Conditions
Test
Condition
Peak Acceleration
(Gravity Units)
Frequency
Range
Approx. Traverse
Time
1
Traverses
Per Axis
Duration
Per Axis
IPC-TM-650
Page 3 of 6
Number
3.12
Subject
Vibration,
Connectors
Date
7/75
Revision
A
Table
1
and
Figure
3
or
4
as
specified
in
the
individual
con¬
nector
specification;
if
no
test
is
specified,
Test
Condition
D
shall
apply.
5.1.2
The
fixtured
test
sample
or
a
suitable
dummy
load
shall
be
mounted
on
the
vibration
exciter
during
the
calibration
procedure.
Any
dummy
load
shall
have
the
mass
and
center
of
gravity
as
that
of
the
test
sample
and
shall
be
fixtured
in
a
similar
manner
(a
reject
connector
provides
an
ideal
dummy
load).
5.1.3
The
control
transducer
shall
be
mounted
on
the
test
fixture
immediately
adjacent
to
the
test
specimen
or
dummy
load.
The
displacement-acceleration
curve
of
the
sinusoidal
input
or
the
equalized
random
input
shall
fall
within,
the
speci¬
fied
tolerances.
5.2
Sinusoidal
Vibration
Test
5.2.1
The
dummy
load
shall
be
replaced
with
the
actual
test
sample.
5.2.2
The
test
sample
shall
be
connected
to
the
discontinu¬
ity
monitor
and
a
minimum
current
of
100
milliamperes
shall
be
established
in
the
series
circuit
comprising
all
contacts
of
the
test
sample.
5.2.3
The
test
sample
shall
be
subjected
to
the
sinusoidal
test
condition
specified
in
the
individual
connector
specifica¬
tion;
the
following
details
shall
apply:
A.
Amplitude
—
The
test
sample
shall
be
subject
to
simple
harmonic
motion
at
an
amplitude
of
0.06
inch
double
amplitude
(peak-to-peak
displacement)
or
the
maximum
acceleration
specified
in
Table
1
,
whichever
is
less.
B.
Frequency
Range
—
The
vibration
frequency
shall
be
var¬
ied
logarithmically
between
the
approximate
limits
speci¬
fied
in
Table
1
;
see
6.2
for
alternate
method.
C.
Range
T
raverse
Time
and
Duration
—
The
entire
fre¬
quency
range
shall
be
traversed
in
a
time
as
specified
in
Table
1
.
The
traverse
(in
either
direction)
shall
be
per¬
formed
the
indicated
number
of
times
along
each
of
three
(3)
orthogonal
axes
for
at
least
the
indicated
total
vibration
period
per
axis.
If
the
procedure
of
Test
Condition
A
is
used
for
the
10
to
55Hz
band
of
Test
Conditions
B,
C
or
E,
the
duration
of
this
portion
shall
be
the
same
as
the
duration
for
this
band
using
logarithmic
cycling
at
the
rate
specified
for
Test
Conditions
B,
C
or
E
(approximately
1-1/3
hours
along
each
of
3
orthogonal
axes).
5.3
Random
Vibration
Test
5.3.1
The
dummy
load
shall
be
replaced
with
the
actual
test
sample.
5.3.2
The
test
sample
shall
be
connected
to
the
discontinu¬
ity
monitor
and
a
minimum
current
of
100
milliamperes
shall
be
established
in
the
series
circuit
comprising
all
contacts
of
the
test
sample.
A
10
5
to
55
Hz
0.5
min.
240
2
hrs.
B
10
10
to
500
Hz
7.5
min.
24
3
hrs
C
15
10
to
2000
Hz
10
min.
24
4
hrs.
d2/3
10
55
to
2000
Hz
40
min.
1
40
min.
E
20
10
to
2000
Hz
10
min.
24
4
hrs.
F
10.94
10
to
2000
Hz
N/A
N/A
15
min.
1
Traverse
time
is
that
time
to
go
from
the
lower
frequency
to
the
higher
frequency,
or
vice
versa.
2Test
Condition
D
shall
be
preceded
by
vibration
tests
per
Test
Condition
A.
3Test
Condition
D
is
intended
to
isolate
resonant
frequencies.
If
resonance
is
detected,
the
test
sample
shall
be
vibrated
at
each
critical
resonant
frequency
for
5
minutes;
critical
resonance
is
defined
as
a
point
on
the
test
sample
observed
to
have
a
maximum
amplitude
(or
acceleration)
more
than
twice
that
of
the
controlled
input.
40verall
root-mean-square
(RMS)
acceleration.
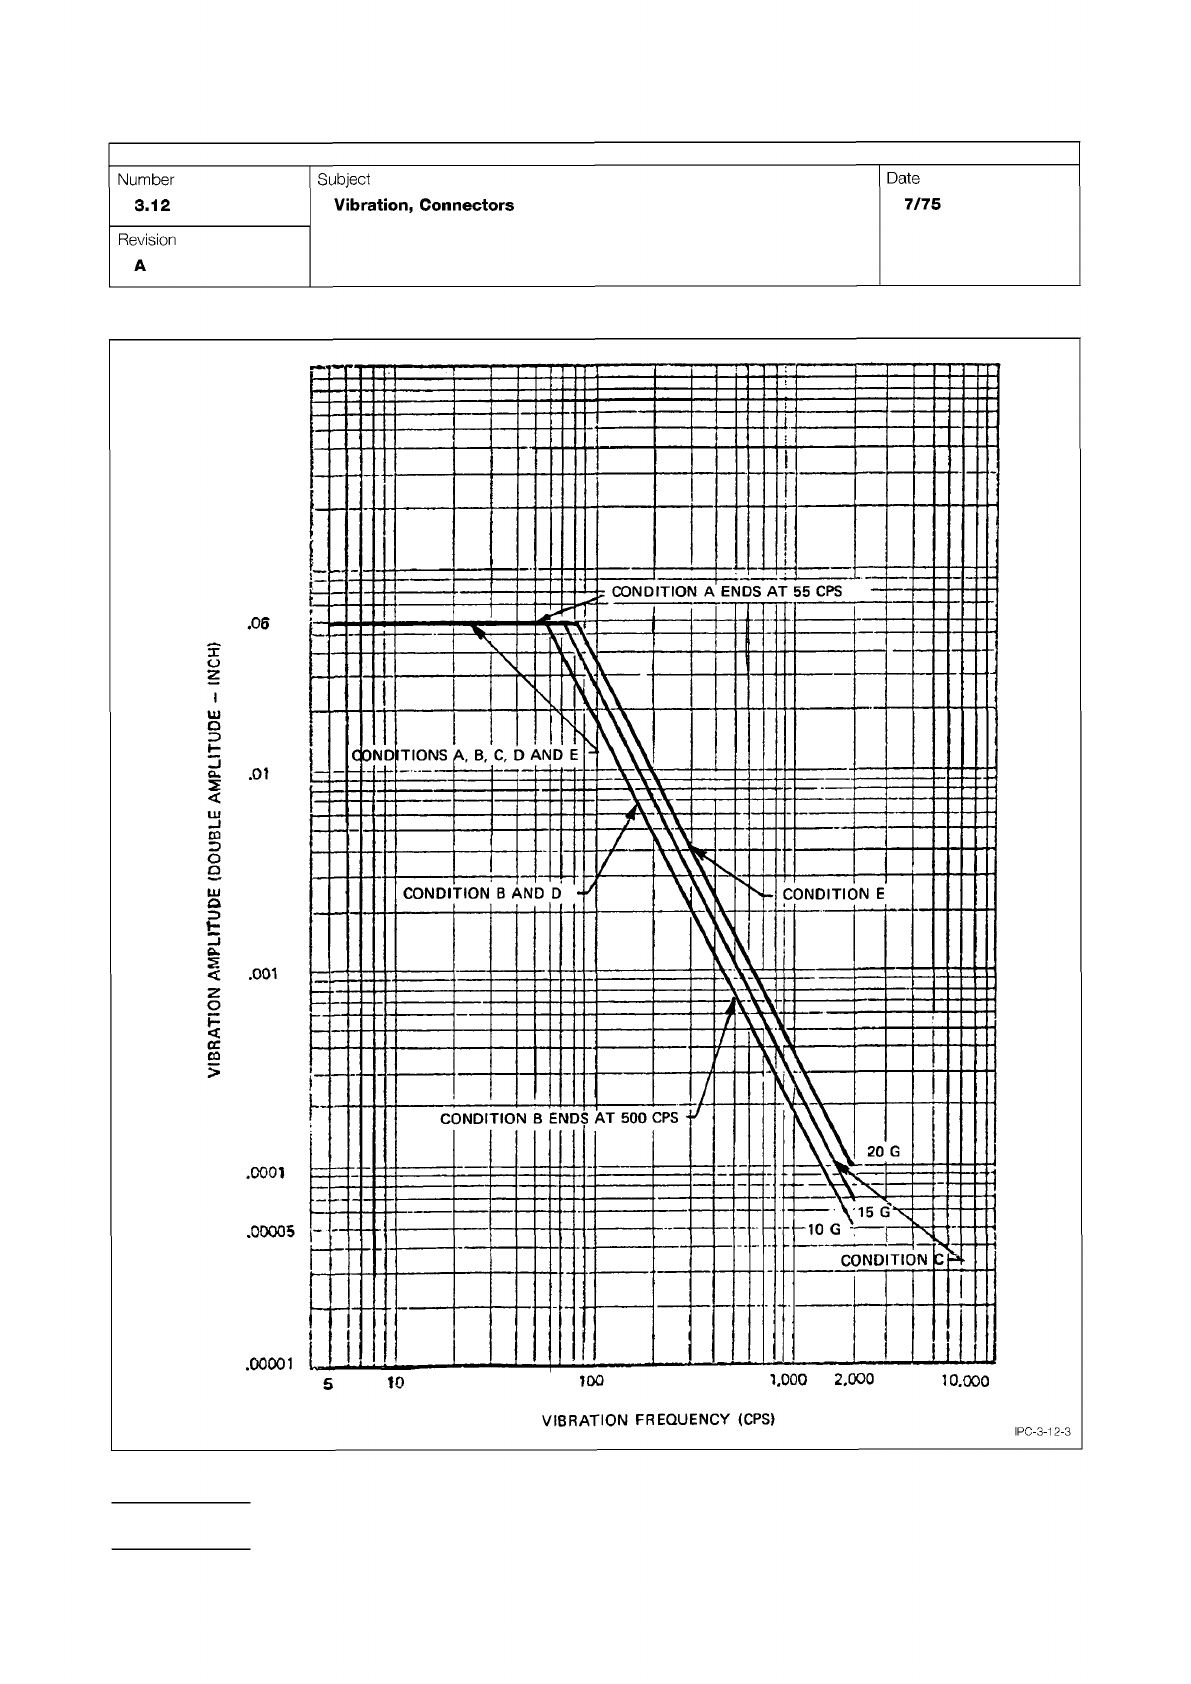
Figure 3 Vibration Test Curves
IPC-TM-650
Page 4 of 6
.0001
.00005
-
.00001
10
L000
2,000
10.000
VIBRATION
FREQUENCY
(CPS)
Number
3.12
Subject
Vibration,
Connectors
Date
7/75
Revision
A
1
00
^§5^
&mno
£
wwldwv
NOUVH
-
A
IPC-3-12-3
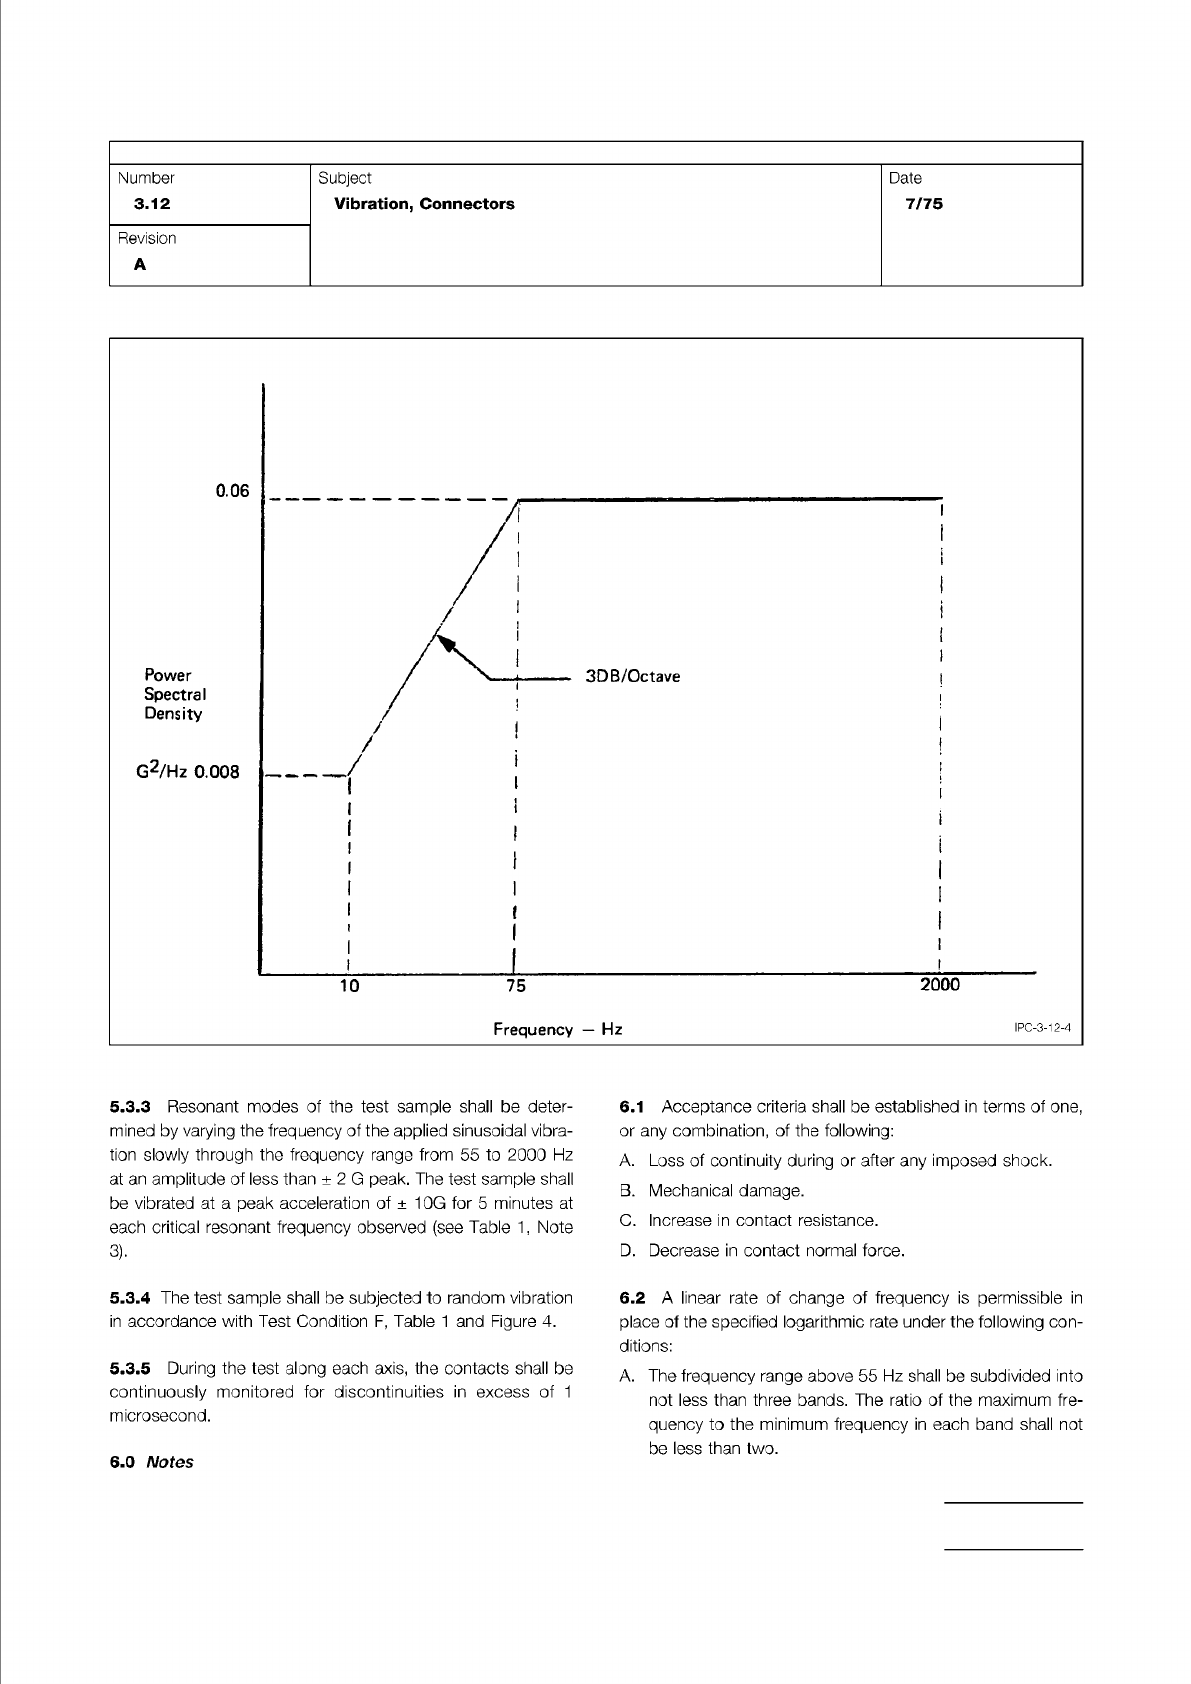
Figure 4 Random Vibration Input
IPC-TM-650
Page 5 of 6
Number
3.12
Subject
Vibration,
Connectors
Date
7/75
Revision
A
0.06
Power
Spectral
Density
G2/Hz
0.008
/1
'
/
>
>
3DB/Octave
|
/
|
।
/
,
!
(
;
1
:
i
;
1
i
1
1
1
i
1
L
10
75
2000
Frequency
—
Hz
ipc-3-12-4
5.3.3
Resonant
modes
of
the
test
sample
shall
be
deter¬
mined
by
varying
the
frequency
of
the
applied
sinusoidal
vibra¬
tion
slowly
through
the
frequency
range
from
55
to
2000
Hz
at
an
amplitude
of
less
than
±
2
G
peak.
The
test
sample
shall
be
vibrated
at
a
peak
acceleration
of
±
10G
for
5
minutes
at
each
critical
resonant
frequency
observed
(see
Table
1
,
Note
3).
5.3.4
The
test
sample
shall
be
subjected
to
random
vibration
in
accordance
with
Test
Condition
F,
Table
1
and
Figure
4.
5.3.5
During
the
test
along
each
axis,
the
contacts
shall
be
continuously
monitored
for
discontinuities
in
excess
of
1
microsecond.
6.1
Acceptance
criteria
shall
be
established
in
terms
of
one,
or
any
combination,
of
the
following:
A.
Loss
of
continuity
during
or
after
any
imposed
shock.
B.
Mechanical
damage.
C.
Increase
in
contact
resistance.
D.
Decrease
in
contact
normal
force.
6.2
A
linear
rate
of
change
of
frequency
is
permissible
in
place
of
the
specified
logarithmic
rate
under
the
following
con¬
ditions:
A.
The
frequency
range
above
55
Hz
shall
be
subdivided
into
not
less
than
three
bands.
The
ratio
of
the
maximum
fre¬
quency
to
the
minimum
frequency
in
each
band
shall
not
be
less
than
two.
6.0
Notes