7_PO-CON1691E - 第4页
4 Integration of steroids analysis in serum using LC-MS/MS with full-automated sample preparation Fig. 3 Calibration Curves (L1-L7) and MRM Chromatograms (L1) of 10 Steroids Result and discussion We evaluated this system…
3
Integration of steroids analysis in serum using LC-MS/MS
with full-automated sample preparation
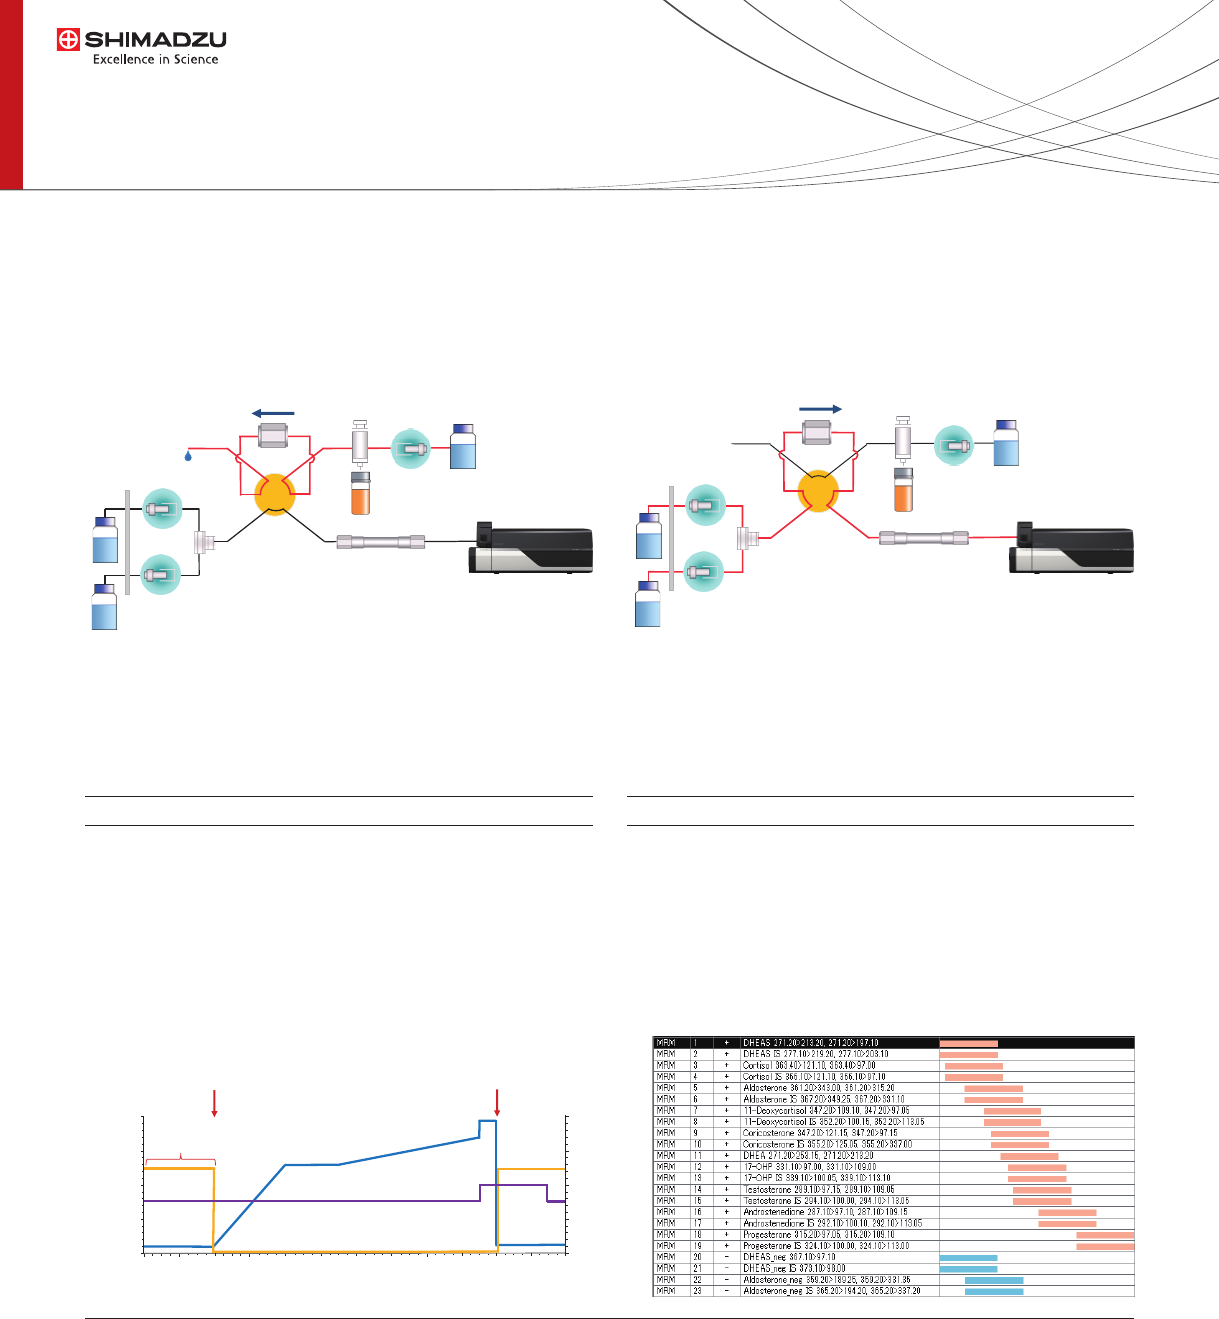
The treated samples were trapped using a MAYI-ODS column and then separated by Core-Shell Biphenyl HPLC column
at 40 ºC with a binary gradient system at a ow rate of 0.3 ml/min in 12 min.
Fig. 2 Flow Diagram of Trapping system
Mobile Phase A : 1mM ammonium uoride – water
Mobile Phase B : Methanol
Mobile Phase C : 10mM ammonium formate – water
Column temperature : 40 ºC
Analytical Column : Kinetex Biphenyl
(100mm L x 2mm I.D. , 2.6μm)
Guard Column : MAYI-ODS column (5mm L x 2mm I.D.)
Injection Volume : 30 µL
Gradient Program :
HPLC
Ionization : heated ESI
Nebulizing Gas Flow : 3 L / min
Drying Gas Pressure : 7 L / min
Heating gas ow : 13 L/min
DL Temperature : 120 ºC
BH Temperature : 450 ºC
Interface Temperature : 370 ºC
MRM parameter :
Mass (LCMS-8060 triple quadrupole mass spectrometry)
Table 1 Analytical Condition
Trap Analysis
pump B
analytical column
LCMS
pump A
pump C
waste
Trap column
12
3 6
54
12
3 6
54
0 4.02.0 6.0
50
100
B Conc. (%)
8.0 10.0
trapping
12.0
Flow (mL/min)
0.2
0.4
0.6
Pump C Flow
Pump A/B Flow
B Conc.
FCV(1-2) FCV(1-6)
4
Integration of steroids analysis in serum using LC-MS/MS
with full-automated sample preparation
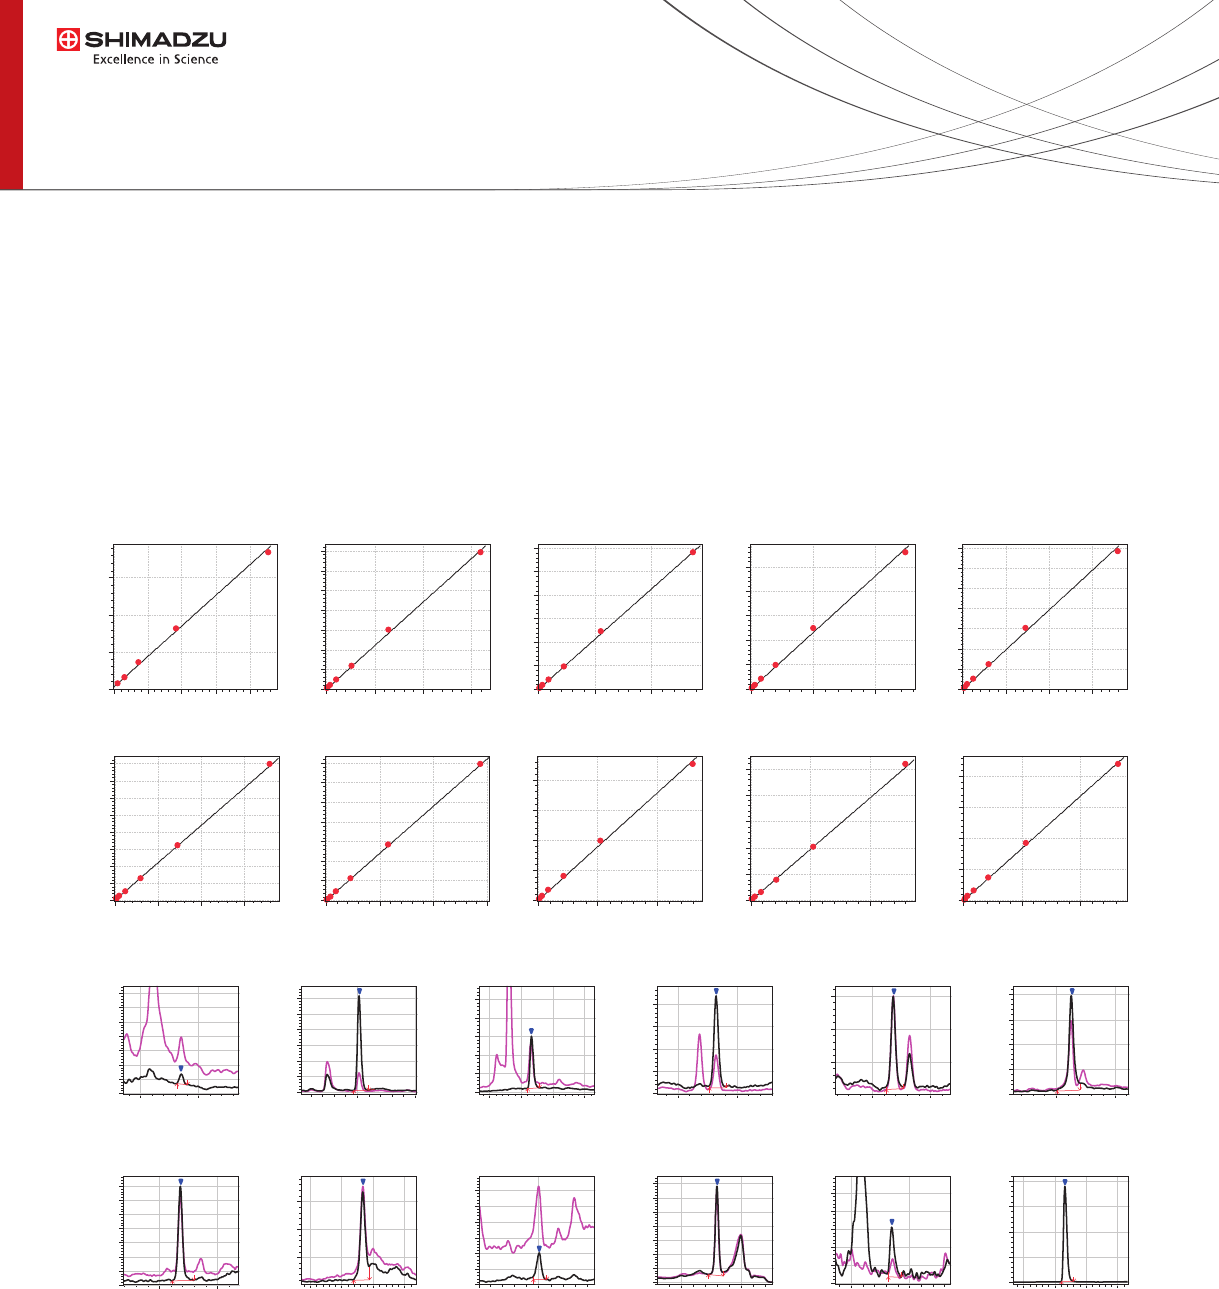
Fig. 3 Calibration Curves (L1-L7) and MRM Chromatograms (L1) of 10 Steroids
Result and discussion
We evaluated this system using calibrator and control
serum spiked with 10 steroids contained in the kit and
carried out concurrent analysis over a range of
concentrations for each steroid: cortisol (1.51-320
ng/mL), aldosterone (0.03-1.14 ng/mL), 11-deoxycortisol
(0.08-18 ng/mL), corticosterone (0.29-62 ng/mL), 17-OHP
(0.12-26 ng/mL), androstenedione (0.08-18 ng/mL),
DHEA (0.31-65 ng/mL), DHEAS (12.9-2750 ng/mL),
progesterone (0.12-26.5 ng/mL) and testosterone
(0.03-7.2 ng/mL). The calibration curves that were
generated had linear regression values of r2 >0.997 for
each curve. The reproducibility (N=3) at seven
concentrations, including LLOQ of each compounds was
excellent (CV<10%).
Aldosterone Cortisol DHEAS Coricosterone 11-Deoxycortisol
Androstenedione Testosterone 17-OHP DHEA Progesterone
0.00 0.25 0.50 0.75 Conc. Ratio
0.00
0.25
0.50
0.75
Area Ratio
0 100 200 Conc. Ratio
0.0
2.5
5.0
7.5
10.0
12.5
15.0
17.5
Area Ratio
0 1000 2000Conc. Ratio
0
10
20
30
40
50
60
Area Ratio
0.0 25.0 Conc. Ratio
0.0
2.5
5.0
7.5
10.0
12.5
Area Ratio
0.0 5.0 10.0 Conc. Ratio
0
1
2
3
4
5
6
7
Area Ratio
0.0 5.0 10.0 Conc. Ratio
0
5
10
15
20
25
30
35
40
Area Ratio
0.0 2.5 5.0 Conc. Ratio
0.0
2.5
5.0
7.5
10.0
12.5
15.0
17.5
Area Ratio
0 10 Conc. Ratio
0
5
10
15
20
Area Ratio
0.0 25.0 Conc. Ratio
0
1
2
3
4
5
Area Ratio
0 10 20Conc. Ratio
0
10
20
30
40
Area Ratio
Aldosterone
(0.03 ng/mL)
Cortisol
(1.51 ng/mL)
DHEAS
(12.9 ng/mL)
Coricosterone
(0.29 ng/mL)
11-Deoxycortisol
(0.08 ng/mL)
Androstenedione
(0.08 ng/mL)
Testosterone
(0.03 ng/mL)
17-OHP
(0.12 ng/mL)
DHEA
(0.31 ng/mL)
Progesterone
(0.12 ng/mL)
Aldosterone (neg)
(0.03 ng/mL)
DHEAS (neg)
(12.9 ng/mL)
5.0 6.0
0.0
1.0
2.0
3.0
4.0
5.0
6.0
7.0
(x10,000)
361.20>343.00(+)
361.20>315.20(+)
5.0 6.0
0.0
0.5
1.0
1.5
2.0
2.5
3.0
(x100,000)
363.40>97.00(+)
363.40>121.10(+)
4.0 4.5 5.0 5.5
0.00
0.25
0.50
0.75
1.00
1.25
(x100,000)
271.20>197.10(+)
271.20>213.20(+)
6.0 7.0
0.00
0.25
0.50
0.75
1.00
(x100,000)
347.20>97.15(+)
347.20>121.15(+)
6.0 7.0
2.5
5.0
7.5
(x10,000)
347.20>97.05(+)
347.20>109.10(+)
8.0 9.0
0.0
0.5
1.0
1.5
2.0
(x100,000)
287.10>109.15(+)
287.10>97.10(+)
4.0 4.5 5.0 5.5
0.0
0.5
1.0
1.5
2.0
(x1,000,000)
367.10>97.10(-)
5.0 6.0
0.0
0.5
1.0
1.5
2.0
2.5
(x1,000)
359.20>331.35(-)
359.20>189.25(-)
9.0 10.0
0.0
0.5
1.0
1.5
2.0
2.5
3.0
3.5
(x100,000)
315.20>109.10(+)
315.20>97.05(+)
7.06.0
0.0
1.0
2.0
3.0
4.0
5.0
6.0
(x10,000)
271.20>253.15(+)
271.20>213.20(+)
6.5 7.0 7.5 8.0
2.5
5.0
7.5
(x10,000)
331.10>109.00(+)
331.10>97.00(+)
7.0 8.0
0.0
1.0
2.0
3.0
4.0
5.0
6.0
7.0
(x10,000)
289.10>109.05(+)
289.10>97.15(+)
r
2
=0.997
r
2
=0.999
r
2
=0.999
r
2
=0.998
r
2
=0.997
r
2
=0.999
r
2
=0.999
r
2
=0.998 r
2
=0.999
r
2
=0.999
CV=6.3%
(N=3)
1.6%
3.9%
4.6%
5.5%
4.6%
3.7%
6.2% 6.5%
3.9%
6.6%
2.1%
5
Integration of steroids analysis in serum using LC-MS/MS
with full-automated sample preparation
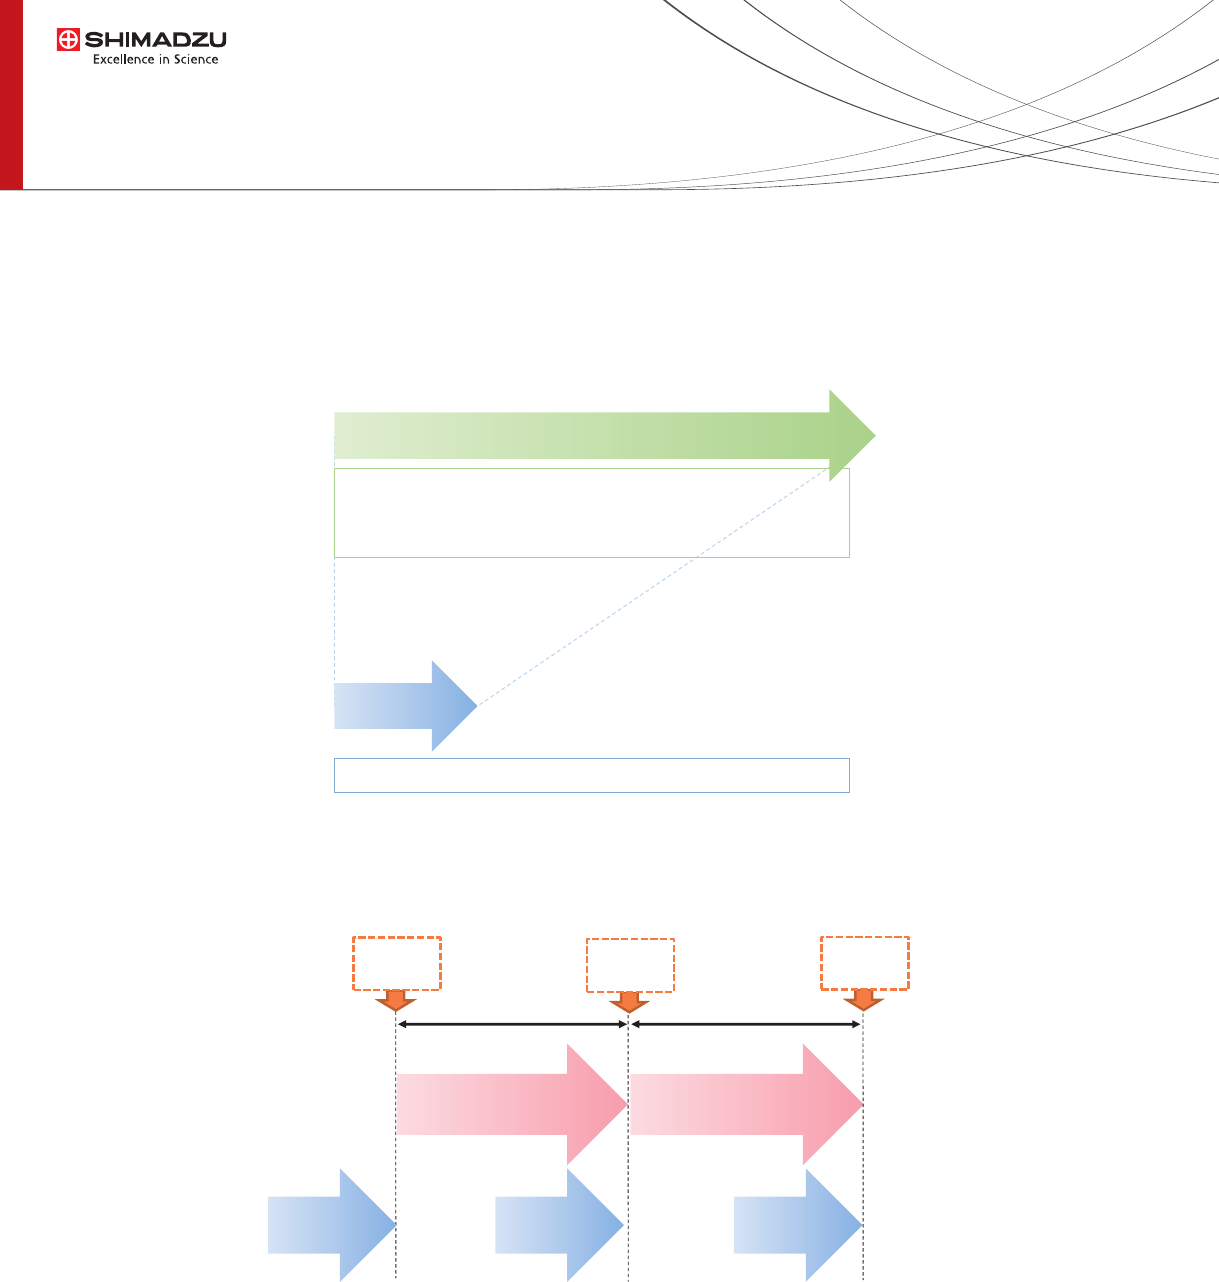
We found that the sample preparation time was reduced from 60 minutes to 6 minutes by the automated system. Thus
sample preparation and LC-MS/MS analysis can be performed in parallel to accelerate throughput.
Fig. 4 Comparison with a time required for sample preparation
Fig. 5 Analytical Flow with Parallel Processing
LC/MS/MS analysis
12min
LC/MS/MS analysis
12min
12min 12min
Sample
injection
Sample
Preparation
6min
Sample
Preparation
6min
60min
6min
• Traditional sample preparation (protein precipitation)
• Automated sample preparation process by CLAM-2000
Add ACN with IS
→
Shake for 15 min
→
Centrifuge for 30 min
→
Transfer the supernatants
→
Dry for >30 min
→
Reconstitute
Add ACN with IS
→
Shake for 3 min
→
Filtrate for 2 min
Sample
injection
Sample
injection
Sample
Preparation
6min