00191017-01.pdf - 第495页
User’s Manual Line Computer UNIX 16 MaDaMaS Software Version 403.xx Edition 06/97 16.2 MaDaMaS Evaluation User Interface 16 - 33 16.2.9.1 "Last PCB" Ev aluation The "La st PCB" evaluati on displ ays f…
16 MaDaMaS User’s Manual Line Computer UNIX
16.2 MaDaMaS Evaluation User Interface Software Version 403.xx Edition 06/97
16 - 32
-
Calling up the "Performance" evaluation for the line
●
On the menu bar select
EVALUATIONS
-->
Overall view
.
The "Overall view" evaluation including the "Performance" chart is displayed
(see Fig. 16.2.1).
-
Calling up the "Performance" evaluation for all placement stations
●
On the menu bar select
EVALUATIONS
-->
Performance
.
Or else:
●
Click on the
blue bar
in the "Performance" chart of the overall view.
●
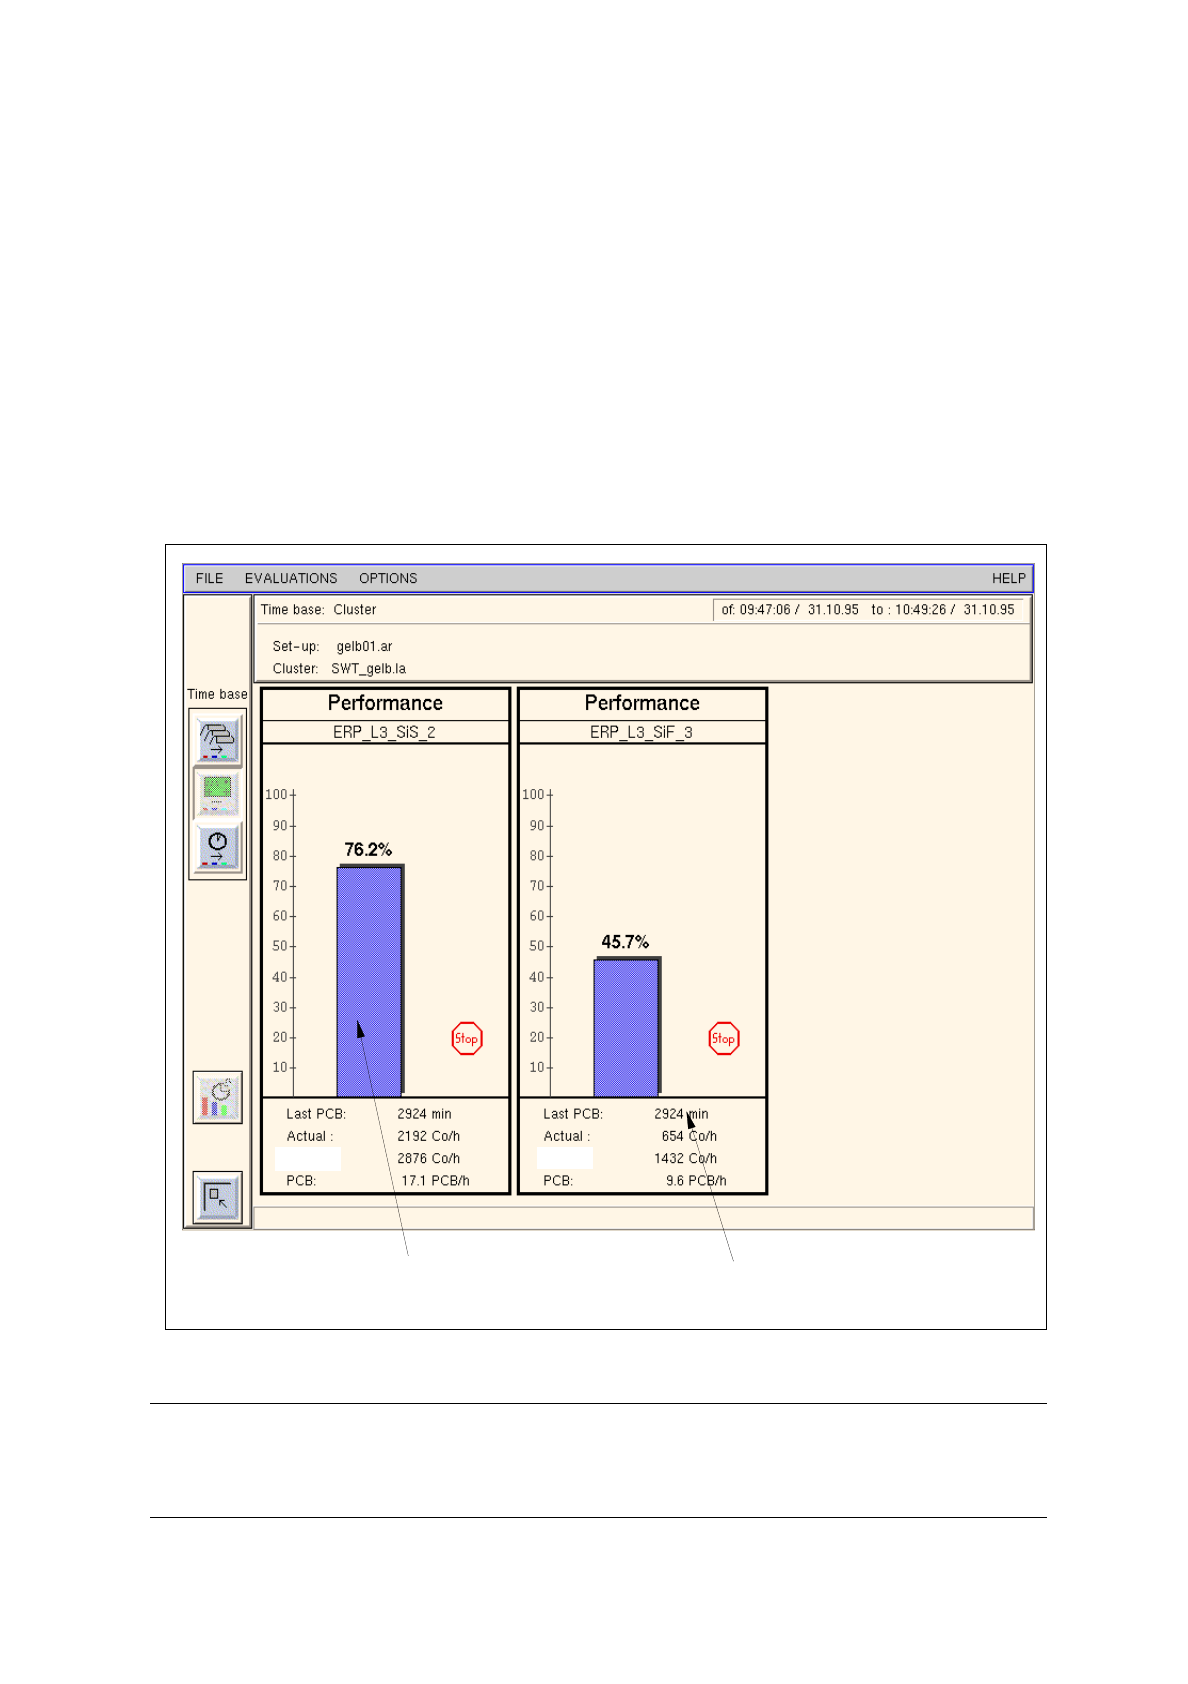
The "Performance" chart is displayed for all placement stations (see Fig. 16.2.9)
Fig. 16.2.9 Evaluation user interface - "Performance" evaluation for all stations
NOTE
If more stations exist than can be displayed in the view area, a scroll bar appears above the info line
permitting the display area to be scrolled.
indication of the time period since the
completion/abortion of the last PCB
bar indicating the relative
performance of the station
theor.:
theor.:

User’s Manual Line Computer UNIX 16 MaDaMaS
Software Version 403.xx Edition 06/97 16.2 MaDaMaS Evaluation User Interface
16 - 33
16.2.9.1 "Last PCB" Evaluation
The "Last PCB" evaluation displays for the entire line and for each station of the line the minutes that have
elapsed since the time of completion (or abortion) of the last PCB.
If this time span, starting with the completion/abortion of the last PCB, exceeds the "Timeout" value preset under
Limit Values, the icon is displayed in the "Performance" chart (see section 16.2.4.1). The station has
come to a standstill.
The "Last PCB" evaluation is of importance owing to the fact that the data will not be updated until a new PCB
has been completed. It is available for the entire line and for all placement stations.
-
Calling up the "Last PCB" evaluation for the line
●
On the menu bar select EVALUATIONS --> Overall view.
The "Overall view" evaluation is displayed.
The "Last PCB" evaluation for the entire line is displayed in the field below the "Performance"
chart (see Fig. 16.2.1).
-
Calling up the "Last PCB" evaluation for all stations
●
On the menu bar select EVALUATIONS --> Performance.
Or else:
●
Click on the blue bar in the "Performance" chart in the overall view.
The "Performance" chart is displayed for all placement stations.
The time that has elapsed since the completion/abortion of the last PCB is displayed for each
station in the field below the "Performance" chart (see Fig. 16.2.9).

16 MaDaMaS User’s Manual Line Computer UNIX
16.2 MaDaMaS Evaluation User Interface Software Version 403.xx Edition 06/97
16 - 34