00196962-04-BA-SX12-V2-EN.pdf - 第237页
User manual SIPLACE SX1/SX2 5 Working with the machine From software version SC 706.1 SP1 Version 10/2014 5.5 The user interface 237 5.5.1 St atus field The sta tus field shows the current machine st atus, the error whic…
5 Working with the machine User manual SIPLACE SX1/SX2
5.5 The user interface From software version SC 706.1 SP1 Version 10/2014
236
5.5 The user interface
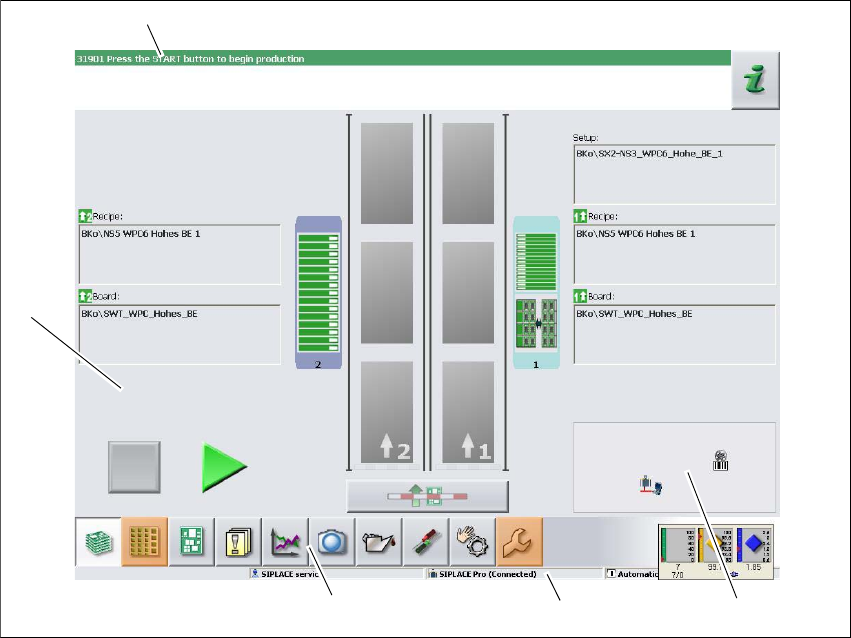
The user interface is divided into the following areas.
The user interface with the "Production" view for the SX machine is shown as an example.
Fig. 5.5 - 1 User interface components in the "Production" (example of SIPLACE SX shown) view
Legend
(1) Status field (status and error display)
(2) Processing area / display area
(3) Toolbar
(4) Information line
(5) View of changed configurations and additional options e.g. barcode mode
(1)
(2)
(3)
(4)
(5)
User manual SIPLACE SX1/SX2 5 Working with the machine
From software version SC 706.1 SP1 Version 10/2014 5.5 The user interface
237
5.5.1 Status field
The status field shows the current machine status, the error which occurred most recently and the
action to be performed.
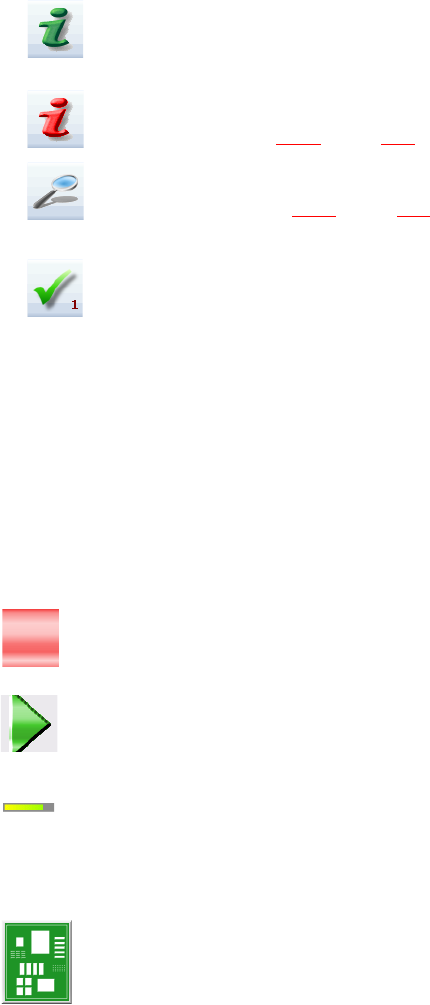
The right-hand side of the status field shows the status with the following icons:
(Green) Starts the context-sensitive Online Help function for the current view. All operating con-
trols for the current view are explained
(Red) Starts the help system, showing the possible causes of the current errors and suitable solu-
tions (see section 5.6.1
, page 244).
Opens a dialog box in which the error source, error message text and the error date with time are
shown (see section 5.6.1
, page 244). The help function for the current error can also be opened
from here.
Deletes the error currently shown from the status field.
5.5.2 Display and processing area
This area shows the buttons for setting/deleting functions, general information about the board,
setup, recipes and other information.
Animated and color-coded items helps explain processes or states (e.g. editing, empty location
etc.).
The "Production" (basic view) view indicates certain operating states (editing, error etc.).
Stop processing. This stops the current processing run.
Continue processing. This starts or continues board placement.
Progress bar
The placement progress is shown for each board on the progress bar.
Boards being processed
The board is taken up by the system and placed. The PCB icon will be shown as a dark green
button.
5 Working with the machine User manual SIPLACE SX1/SX2
5.5 The user interface From software version SC 706.1 SP1 Version 10/2014
238
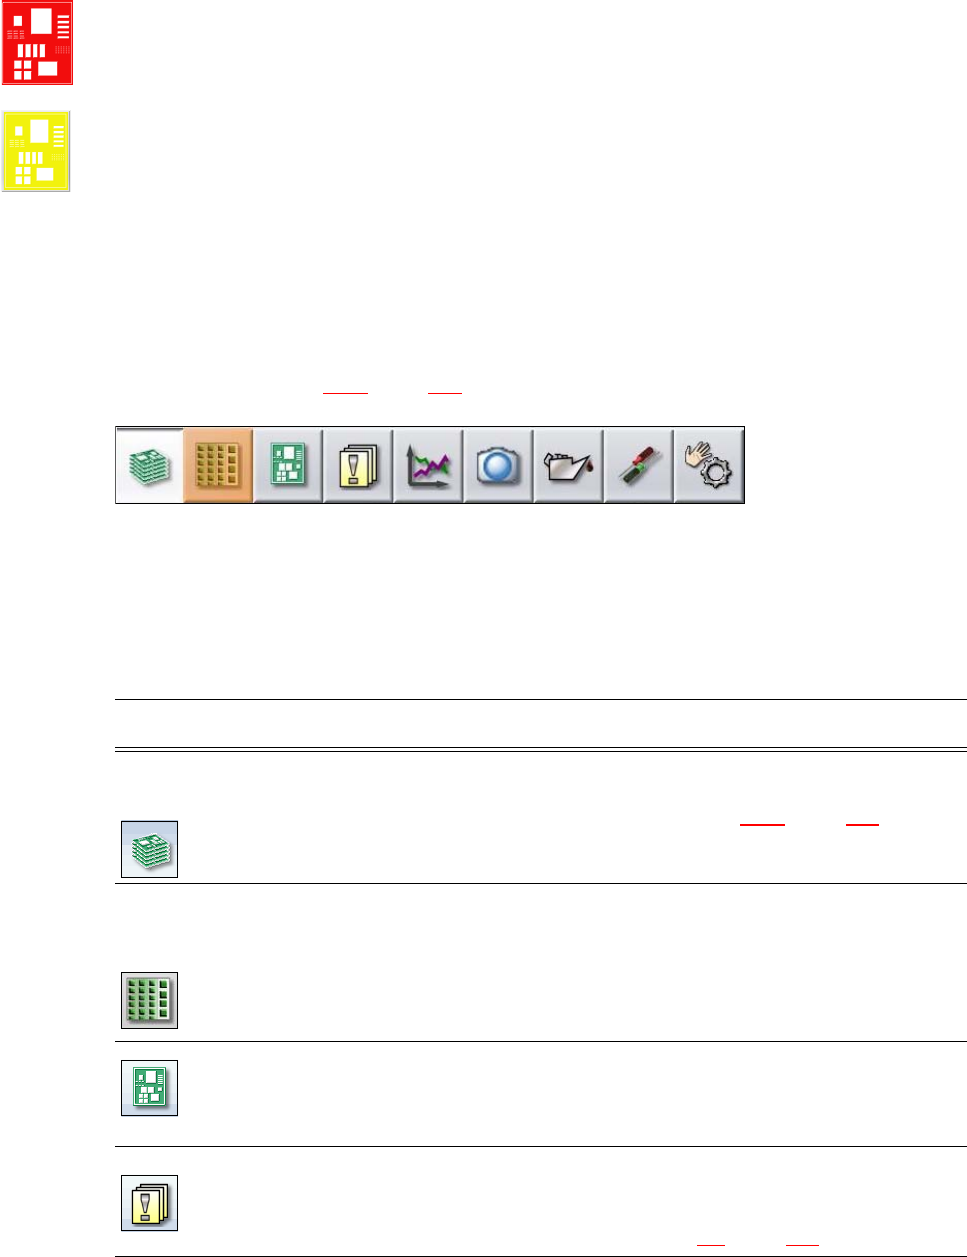
Board processing terminated
If processing is terminated, the PCB icon will be shown in red.
Check the board
If the board is in the output conveyor and the board status needs to be checked by the operator,
the PCB icon will be shown in yellow.
5.5.3 Toolbar
The toolbar contains buttons for the main station software functions.
These enable you to switch the user interface over to other views and to use the functions avail-
able there (see section 5.5.5
, page 242).
5
Fig. 5.5 - 2 Toolbar
The buttons vary according to your individual configuration and the operator level set. Some views
are only available in higher operator levels.
The following table briefly describes the buttons and main functions.
5
Icon View Description
Production
(main view)
Shows the machine status for the most frequently performed tasks
during production.
Shows the operating states, see section 5.5.2
, page 237.
Shows locations, name of setup, name of recipe, configuration
changes and additional options.
Feeder modules,
components and
nozzles
The setup can be individually opened for each of the 4 locations.
Allows you to check and configure feeder modules, components
and nozzles.
Allows you to teach component shapes and component pocket
shapes.
Shows the component level indicator.
PCBs Shows the boards and placement positions list.
Allows you to check and configure boards and components.
Allows you to teach fiducials.
Notifications Shows notifications about current and previous events. The notifi-
cations vary according to their type. Individual tables can be viewed
for track errors, conveyor errors, machine errors, general errors and
linked error messages (see section 5.6
, page 243).