00191297-02.pdf - 第251页
User Manual S-23 HM 6 Vision functions Software Vers ion SR.405.xx 05/99 Iss ue 6.6 Test Component 249 – F actor fo r the qual ity of me asureme nt. Use Esc to qu it this option. Th e video i mage d isappears and the T e…
6 Vision functions User Manual S-23 HM
6.6 Test Component Software Version SR.405.xx 05/99 Issue
248
6
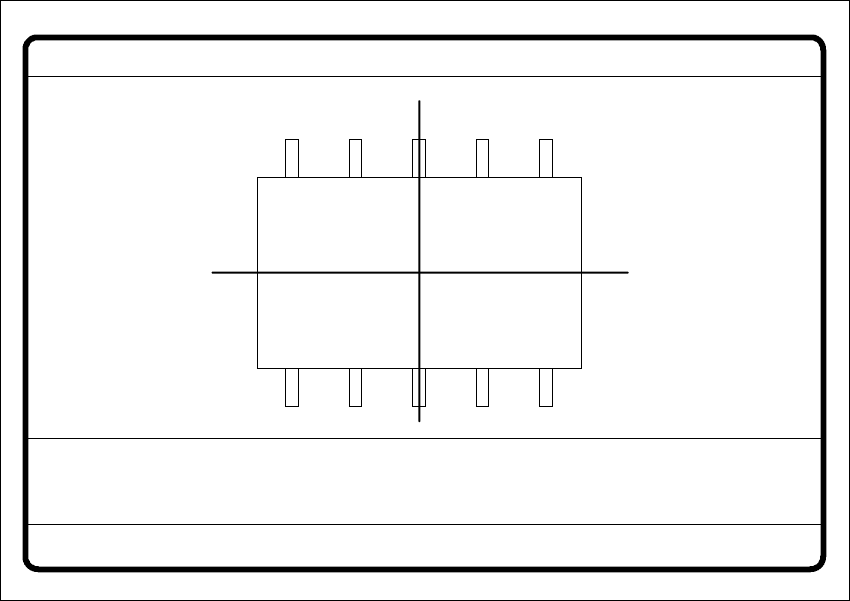
Fig. 6.6 - 21 Test component menu, Measure component video image
Optical surveying of conventional components with lead connections 6
The crosshairs indicate the component’s center. The component outlines are emphasized in
color. 6
The measured values represent the geometric component parameters such as 6
– Lead skew
The value for lead skew will be indicated if you have selected the lead or ball measurement
mode.
–Pitch
The value for pitch will be indicated if the corner measurement mode is active as the last mea-
surement step.
– Number of leads
– x / y offset
– Orthogonality
– Dimensions of the component
–Skew and
Measure component GF No. = 5
X offset = ... Y offset = ... Phi = ...
Orthogon = ...
No. of pins = ...
Quality fact. = ...
Length[mm] = ...
Width[mm] = ...
Spacing[mm] =
RET: Measure component
P.dev.[mm] =
User Manual S-23 HM 6 Vision functions
Software Version SR.405.xx 05/99 Issue 6.6 Test Component
249
– Factor for the quality of measurement.
Use Esc to quit this option. The video image disappears and the Test component menu is dis-
played once more on the screen. 6
Color overlays of the individual measurement steps during step mode 6
1. Size-driven mode 6
See Section 6.6.4.14 on page 273 for a definition of the measuring methods. 6
You can recognize this measurement method by rotating windows around the component edges 6
Procedure: 6
(1) Inside the search window, profiles are created in the x and y directions. With the aid of the
gradients thus formed and a geometric filter, the approximate position of the component is
determined.
(2) Windows rotate around the component’s edges. The profile and gradients are determined for
each window. The sum of the gradients is an indication of the agreement of the window angle
with the position of the component.
If the sum of the gradients reaches a maximum, the angular position of the component has
been determined.
(3) Under the angle determined in step (2) the first step (1) is repeated. Now it will be possible
to determine the position of the component in the x and y directions more accurately.
Rectangles:
green: x and y pick-up tolerances 6
orange: component dimensions and tolerances supplied by the station 6
blue: search area for position recognition 6
6
Comments 6
1. The position of the component as determined must be within the green rectangle
otherwise the component will not be placed. 6
Applies to all measurement steps! 6
2. The component must be located within the orange window. Otherwise the measurement
results will not be dependable. 6
3. The search areas should have the same alignment as the component and also be larger
than the component. 6
6 Vision functions User Manual S-23 HM
6.6 Test Component Software Version SR.405.xx 05/99 Issue
250
Lines: 6
red: Edges of the component detected 6
Comments: 6
The red lines may often be covered by others and thus possibly not detectable. 6
Overlay: 6
gray: Profile in the integration direction in question 6
blue: Gradients from the above profiles 6
yellow: Results from the geometric filter 6
red: Interpolation limits for position determination 6
light blue: Results of interpolation -> Position 6
Comments: 6
The results of interpolation should be found around the maximum of the geometric filter. 6
Cross: 6
white: Results of position recognition -> x and y angles 6
Diagram: 6
Results function of the angle search (rotating windows). 6
Comments: 6
The minimum (corresponds to the maximum of the sum of the gradients) indicates the non-
interpolated angular position. The final results (via interpolation) are indicated by a light blue
line. The precision of the diagram is limited by the resolution of the monitor. 6
6
6
2. Row-driven mode
See Section 6.6.4.14 on page 273 for a definition of the measuring methods. 6
You can recognize this measurement method by the presence of windows around the central lead
of a row of leads. 6
Procedure: 6
(1) Position recognition takes place by creating a profile vertical to the direction of the rows. In
this way the edges of the component are determined.
(2) With two additional windows the angular position of the component can be determined.
6
6