80S-2080F480F4-680F5 User’s Manual.pdf - 第311页
5 Vision Functions SIPLACE 80S-20/F4/F4-6/F5 User’s Manual 5.6 Test Component Edition 03/98 from Software Version SR.404.xx 5 - 90 Line engine er – Orthogo nality – Dimens ions of the compon ent – Skew and – Factor for t…
SIPLACE 80S-20/F4/F4-6/F5 User’s Manual 5 Vision Functions
Edition 03/98 from Software Version SR.404.xx 5.6 Test Component
Line engineer 5 - 89
With flip-chips the balls are arranged irregularly over the body of the component body. The coordinates of
each connection will therefore need to be ascertained individually.
The IC head of the 80F
4
, 80F
4
-6 or 80F
5
machine picks up the BGAs or flip-chips from flatpack magazines.
However the evaluation procedures used to date for conventional components are no longer adequate for the
optical centering of BGAs or flip-chips. For this reason new evaluation methods and new lighting techniques
have been developed for the IC sensor and FC sensor in order that this new generation of components can
be centered. BGAs and flip-chips which cannot be centered optically will be returned to the flatpack maga-
zines by the IC head.
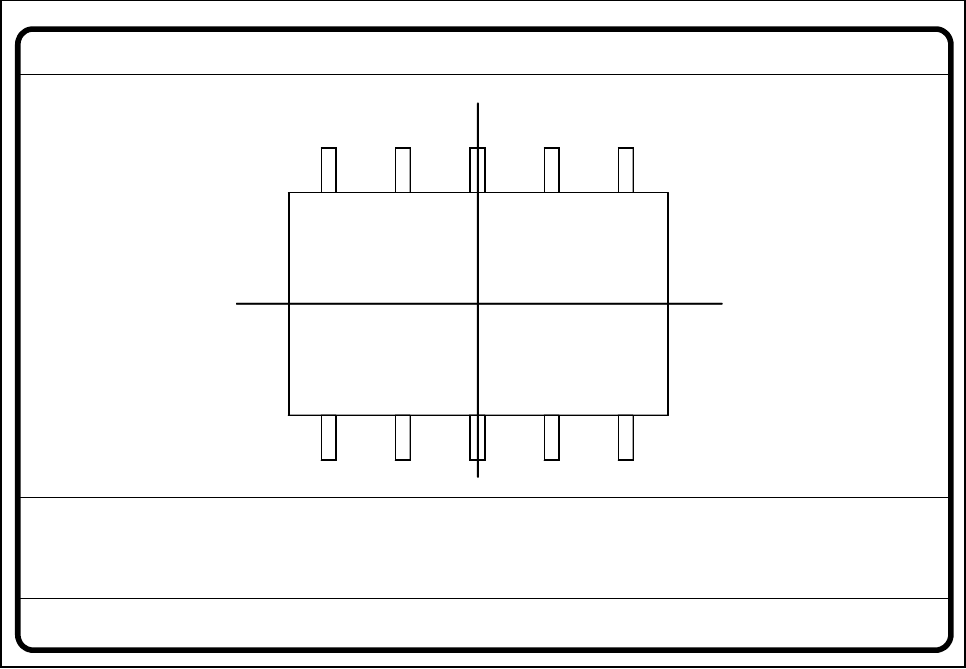
Fig. 5.6.15 Test component menu, Measure component video image
Optical surveying of conventional components with lead connections with the 80S-20 and 80F
4
/F
4
-6/F
5
place-
ment machines:
The crosshairs indicate the component’s center. The component outlines are emphasized in color.
The measured values represent the geometric component parameters such as
– Lead skew
The value for lead skew will be indicated if you have selected the lead-driven measurement mode.
– Pitch
The value for pitch will be indicated if the corner-driven measurement mode is active as the last measure-
ment step.
– Number of leads
– x / y offset
Measure component GF No. = 5
X offset = ... Y offset = ... Phi = ...
Orthogon = ...
No. of pins = ...
Quality fact. = ...
Length[mm] = ...
Width[mm] = ...
Spacing[mm] =
RET: Measure component
P.dev.[mm] =
5 Vision Functions SIPLACE 80S-20/F4/F4-6/F5 User’s Manual
5.6 Test Component Edition 03/98 from Software Version SR.404.xx
5 - 90 Line engineer
– Orthogonality
– Dimensions of the component
– Skew and
– Factor for the quality of measurement.
Use Esc to quit this option. The video image disappears and the Test component menu is displayed once
more on the screen.
Color overlays of the individual measurement steps during step mode
1. Size-driven mode
See Section 5.6.4.14 from Page 5 - 109 for a definition of the measuring methods.
You can recognize this measurement method by rotating windows around the component edges
Procedure:
I. Inside the search window profiles are created in the x and y directions. With the aid of the gradients thus
formed and a geometric filter the approximate position of the component is determined.
II. Windows rotate around the component’s edges. The profile and gradients are determined for each win-
dow. The sum of the gradients is an indication of the agreement of the window angle with the position of
the component.
If the sum of the gradients reaches a maximum the angular position of the component has been deter-
mined.
III. Under the angle determined in step II the first step (I) is repeated. Now it will be possible to determine the
position of the component in the x and y directions more accurately.
Rectangles:
green: x and y pick-up tolerances
orange: component dimensions and tolerances supplied by the station
blue: search area for position recognition
Comments
1. The position of the component as determined must be within the green rectangle otherwise the
component will not be placed.
Applies to all measurement steps!
2. The component must be located within the orange window otherwise the measurement results will
not dependable.
3. The search areas should have the same alignment as the component and also be larger than the
component.
Lines:
red: Edges of the component detected
Comments:
The red lines may often be covered by others and thus possible not detectable.
SIPLACE 80S-20/F4/F4-6/F5 User’s Manual 5 Vision Functions
Edition 03/98 from Software Version SR.404.xx 5.6 Test Component
Line engineer 5 - 91
Overlay:
gray: Profile in the integration direction in question
blue: Gradients from the above profiles
yellow: Results from the geometric filter
red: Interpolation limits for position determination
light blue: Results of interpolation -> Position
Comments:
The results of interpolation should be found around the maximum of the geometric filter.
Cross:
white:Results of position recognition-> x and y angles
Diagram:
Results function of the angle search (rotating windows).
Comments:
The minimum (corresponds to the maximum of the sum of the gradients) indicates the non-interpo-
lated angular position. The final results (via interpolation) are indicated a light blue line. The preci-
sion of the diagram is limited by the resolution of the monitor.
2. Row-driven mode
See Section 5.6.4.14 from Page 5 - 109 for a definition of the measuring methods.
You can recognize this measurement method by the presence of windows around the central lead of a row of
leads.
Procedure:
I. Position recognition takes place by creating a profile vertical to the direction of the leads. In this way the
edges of the component are determined.
II. With two additional windows the angular position of the component can be determined.
Rectangles:
green: x and y pick-up tolerances
light blue: A. 2 to 4 search windows for position recognition. These are positioned around the
central lead of each row of leads.
B. 2 additional search windows for angular measurement. The two windows are
located on the same row of leads.
Star:
orange: Results of approximate search
Comments:
The star indicates the position in the direction of the leads. Depending on which measurement algo-
rithm has been selected the middle or the tip of the lead will be displayed.