4OM-1064-001.pdf - 第61页
Tg0249-PM-MM • When one of the data keys is pressed, the feeder No. with the biggest parameter under the selected data key is dis- played in the first line and feeder Nos. having the subse- quent (second, third, fourth, …
Tg0249-PM-MM
TOTAL P.E.C. RECOGNITION ERRORS
Shown is the total number of errors detected by the P.E.C.
recognition function.
The number of errors detected by the global P.E.C. recog-
nition function and the number of errors detected by the
B.B.R. recognition function are added and displayed.
1PT. ERRORS (% OF TOTAL P.E.C. ERR)
Shown are the total number of errors detected on the
first fiducial mark and the percentage of the detected
errors per total number of all errors detected by the
P.E.C. recognition function.
2PT. ERRORS (% OF TOTAL P.E.C. ERR)
Shown are the total number of errors detected on the
second fiducial mark and the percentage of the de-
tected errors per total number of all errors detected
by the P.E.C. recognition function.
3PT. ERRORS (% OF TOTAL P.E.C. ERR)
Shown are the total number of errors detected on the
third fiducial mark and the percentage of the detected
errors per total number of all errors detected by the
P.E.C. recognition function.
LOCAL FIDUCIAL ERR (% OF TOTAL P.E.C. ERR)
Shown are the total number of recognition errors in
each individual components and the percentage of the
detected errors per total number of all errors detected
by the P.E.C. recognition function.
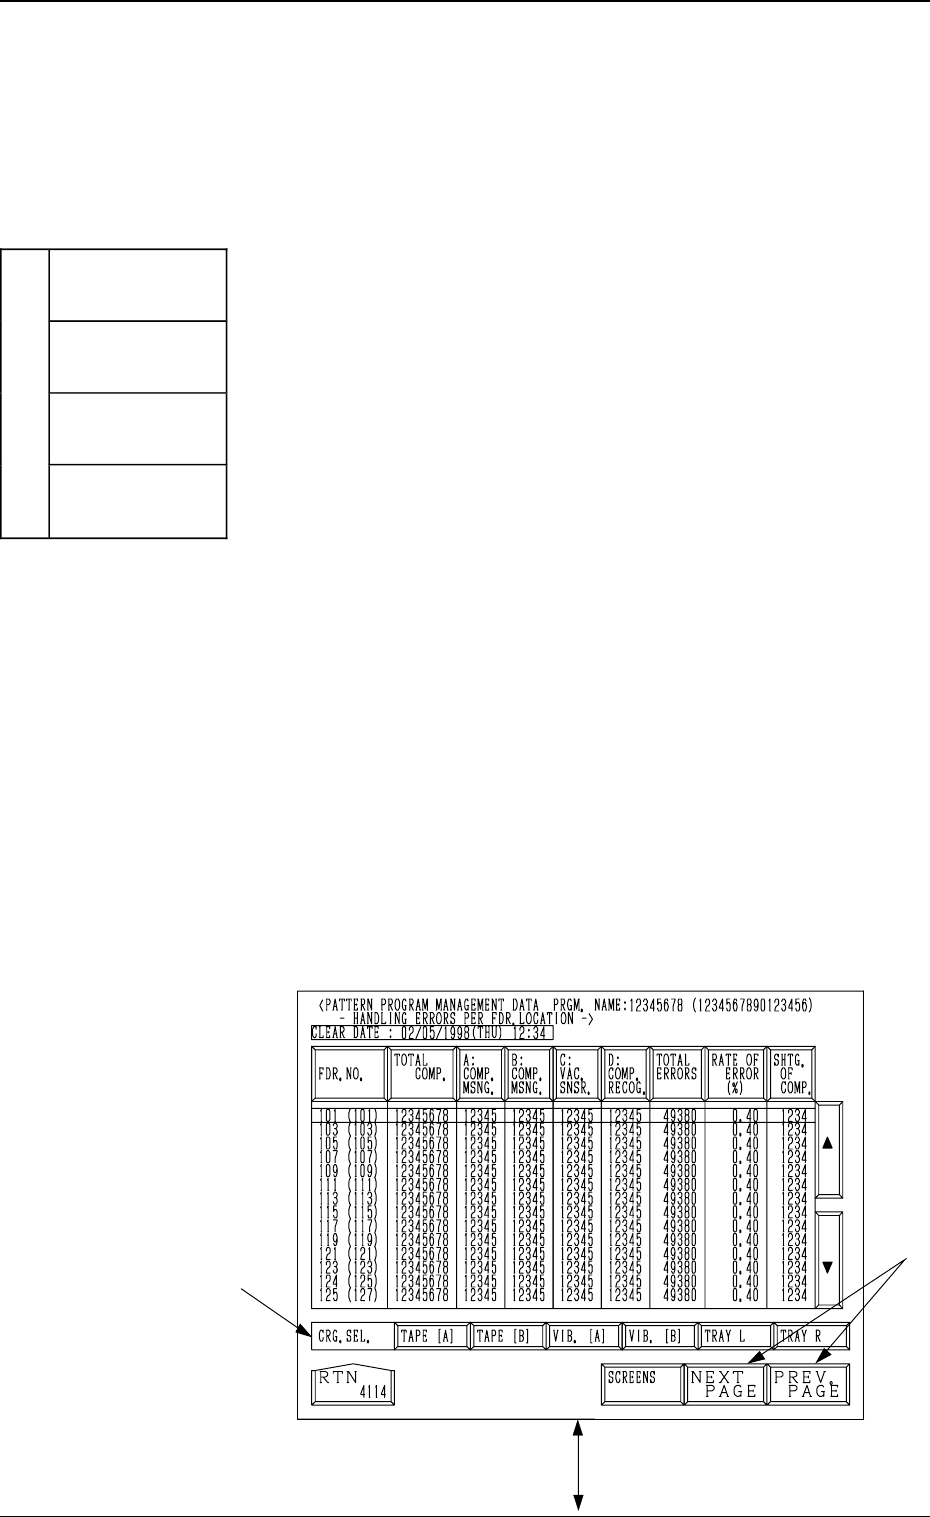
(3) Handling Errors Per Feeder Location
When the pattern program to be checked is selected by
pressing the corresponding “NAMES (XX/XX)” key and
the [HANDLING ERR. PER FDR. LCTN.] key is pressed,
the following display appears on the screen.
Every time the [SCREENS] key is pressed, another dis-
play appears on the screen.
Note: The -marked items are optional.
Fig. 3.6-1
*A
[SCREENS] Key
3. MANAGEMENT DATA Display
9910-001 3-14
Each parameter allocated to the
total P.E.C. recognition error area
is classified by colors and charted
by columns.
(Data is updated every 5 seconds.)
1PT. ERRORS
(Blue)
2PT. ERRORS
(Light Green)
3PT. ERRORS
(Blue)
TOTAL P.E.C. RECOGNITION
ERRORS
(
Li
g
ht Red
)
LOCAL
FIDUCIAL ERR
(Light Gray)
Tg0249-PM-MM
•
When one of the data keys is pressed, the feeder No. with
the biggest parameter under the selected data key is dis-
played in the first line and feeder Nos. having the subse-
quent (second, third, fourth, ...) biggest parameters follow.
Parameters are displayed in order of error counts, making
it easy to analyze and improve production rate.
When the [FDR. NO.] key is pressed, the parameters are
re-arranged in the default order (ascending order of feeder
Nos.).
•
When one of the carriage selection keys ([TAPE (A)],
[TAPE (B)], [TRAY L] (Option), and [TRAY R] (Option)
keys) is pressed, the parameters related to the selected feeder
carriage are displayed.
[FDR. NO.] Key
Shown under this key are the feeder Nos.
The numbers in ( ) indicate the actual feeder Nos. where
the offset data is added.
[TOTAL COMP.] Key
Shown is the total number of components (the number of
pick-up operations) picked at each feeder.
[A: COMP. MSNG.] Key
Shown is the total number of missing components detected
by the vacuum sensor for each lane (feeder slot No.).
[B: COMP. MSNG.] Key
Shown is the total number of missing components detected
in the recognition processing for each individual feeders.
[C: VAC. SNSR.] Key
Shown is the total number of component pick-up errors de-
tected by the vacuum sensor (errors not detected through
the component recognition) for each individual feeders.
[D: COMP. RECOG.] Key
Shown is the total number of recognition errors detected in
the recognition processing for each individual feeders.
[TOTAL ERRORS] Key
Shown is the total number of errors detected by the above-
described functions ([A: COMP. MSNG.] through [D:
COMP. RECOG.] Keys).
Fig. 3.6-2
*A
3. MANAGEMENT DATA Display
9910-001 3-15
Tg0249-PM-MM
[RATE OF ERROR (%)] Key
Shown is the percentage of the total number of errors per the number of
picked components.
[SHTG. OF COMP.] Key
Shown is the total number of component shortage errors detected for each
individual feeders.
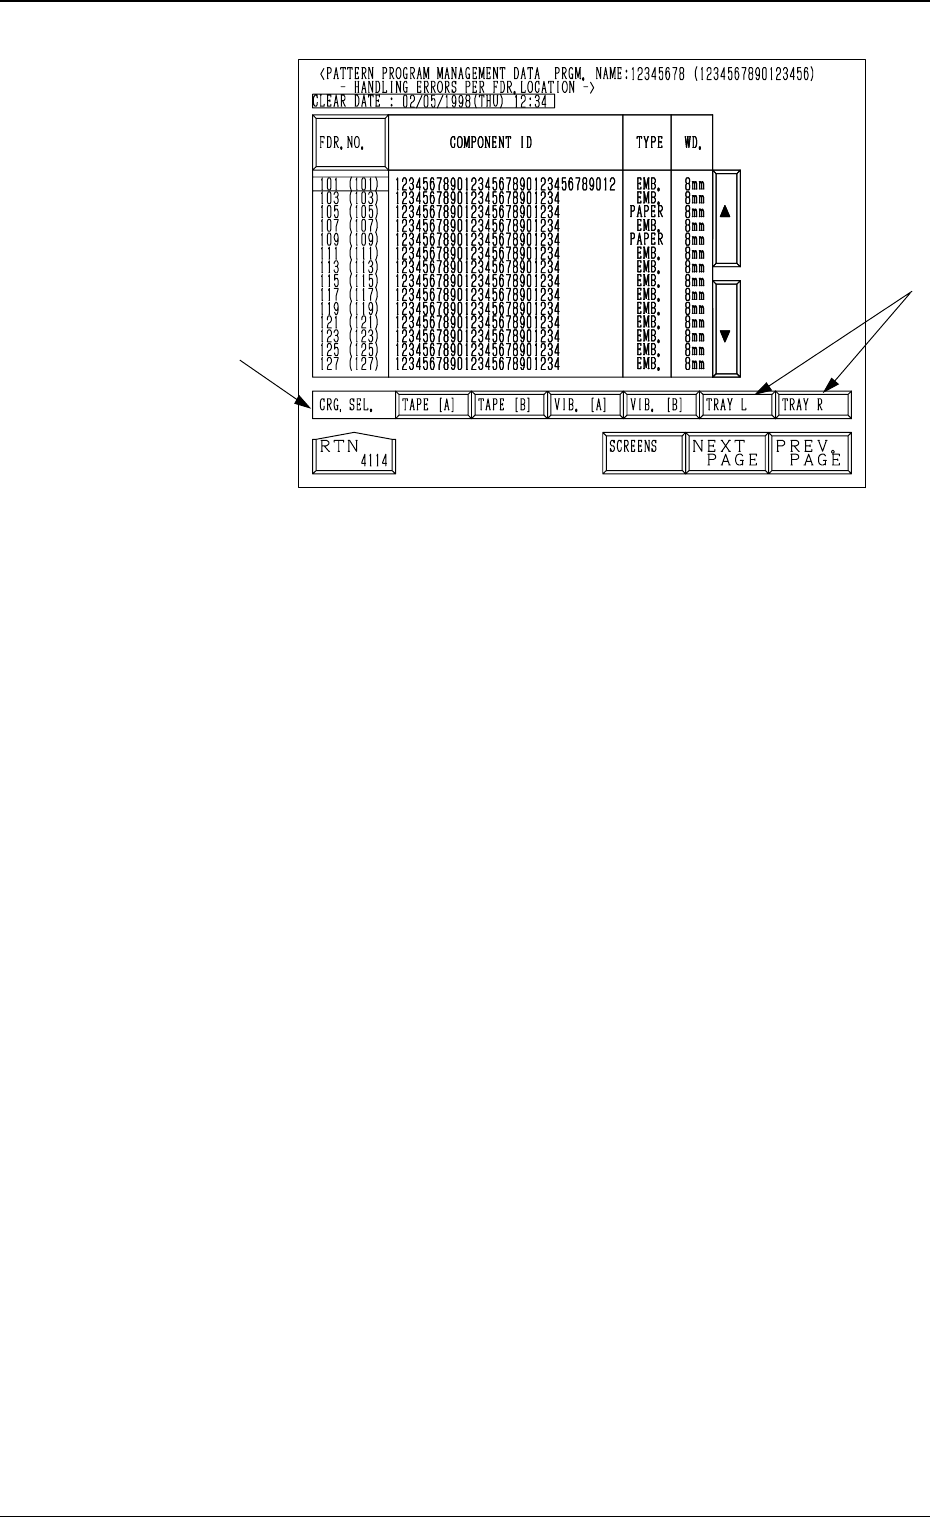
COMPONENT ID
Shown are the component IDs for each individual feeders.
TYPE
Shown are the types of tapes for the related component IDs.
(Paper, Embossed, Adhesive, Bulk, Bulk 2 Tapes or Stick, Vibratory Stick,
Tray Feeders, etc.)
WD.
Shown are the widths of tapes for the related component IDs.
(8 mm, 12 mm, 16 mm, 24 mm, 32 mm, 44 mm, 56 mm, or 72 mm)
Note: When a stick, a vibratory stick, or a tray feeder is used, “- - - - -”
appears in the data field.
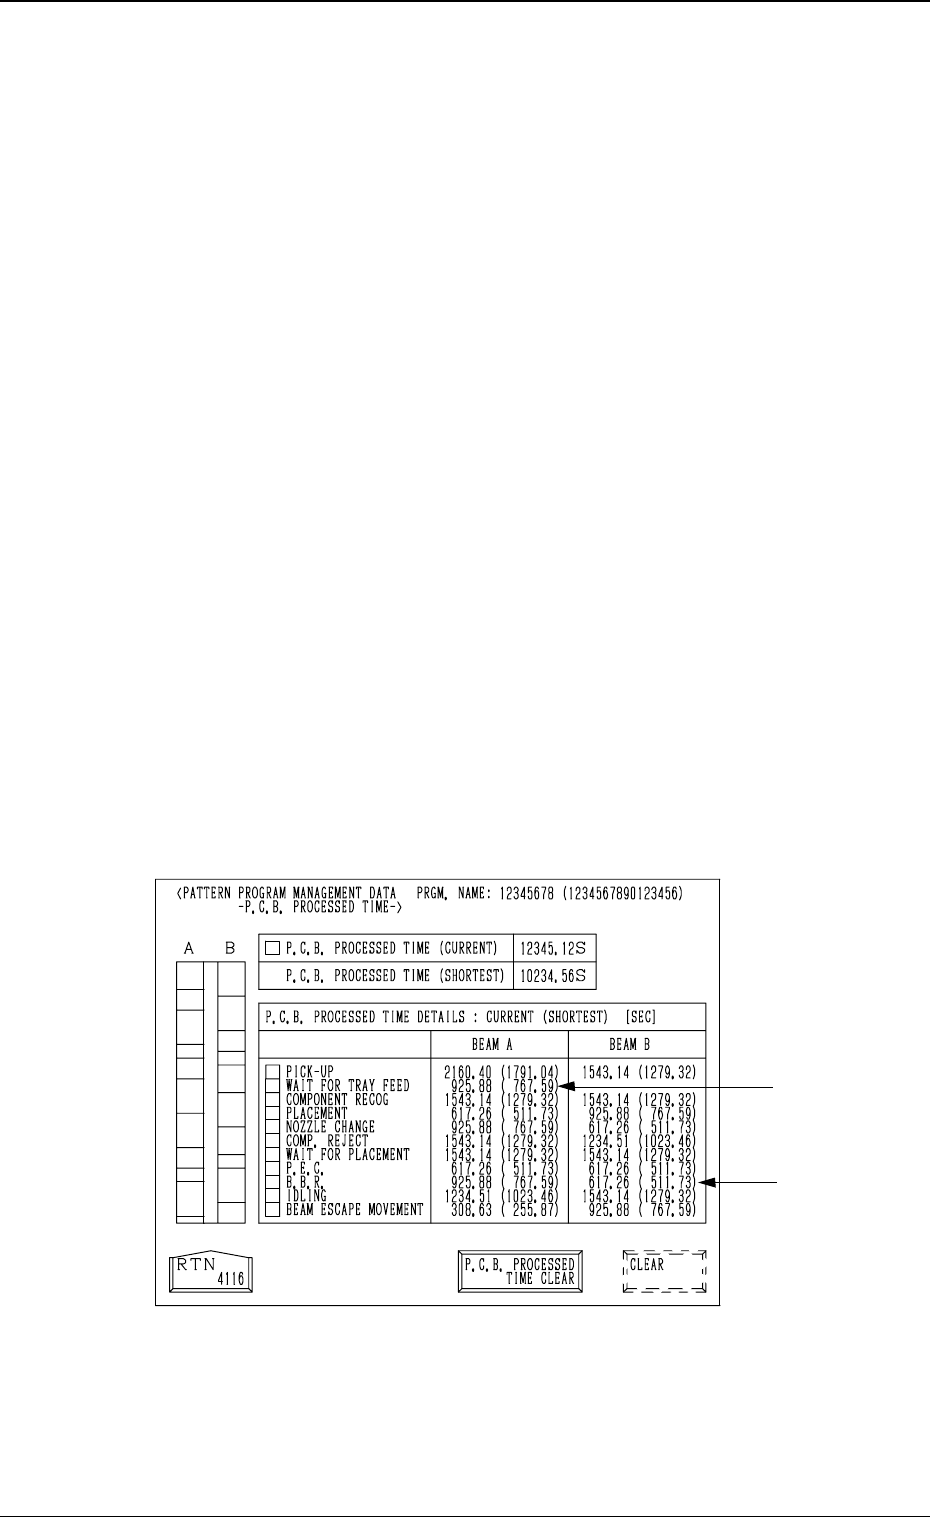
(4) P.C.B. Processed Time
When the [P.C.B. PROCESSED TIME] key is pressed at the “PATTERN
PROGRAM MANAGEMENT DATA” display, the following display ap-
pears on the screen.
Notes: (a) Shown are the periods of time during which the X/Y beam
is completely zeroed after the machine starts to transfer a
P.C.B. to the P.C.B. positioning section and completes the
last component placement operation.
(b) When the multi-layer tray feeder (option) is used, the P.C.B.
processing time may differ greatly (compared with other
feeders), depending upon the following conditional differ-
ence.
•
Travel of X/Y Beam (Direct Pick-Up from Tray)
•
Waiting Time, etc., due to the pullout/pushback actions
of the pallet
(c) The -marked items are optional.
P.C.B. PROCESSED TIME (CURRENT)
Shown is the newest P.C.B. process time.
P.C.B. PROCESSED TIME (SHORTEST)
Shown is the shortest P.C.B. process time required so far.
[P.C.B. PROCESSED TIME CLEAR] and [CLEAR] Keys
To clear the data in the “P.C.B. PROCESSED TIME (CURRENT)” and
“P.C.B. PROCESSED TIME (SHORTEST)” text boxes, press the [P.C.B.
PROCESSED TIME CLEAR] key and then the [CLEAR] key.
Fig. 3.7
3. MANAGEMENT DATA Display
9910-001 3-16