IPC-4556 印制板化学镍钯浸金(ENEPIG)规范ENG.pdf - 第37页
T able A4-1 Summary of XRF Configuration Solutions Of fered for Measurement of ENEPIG Plating on PCB’s with Advantages and Disadvantages ENEPIG Layer Proportional Counter XRF Solid State Detector XRF V acuum & Solid S…

Solid state based XRF instruments offer some advantage for Pd measurement as well.
Although the varying background scatter issue is still present, the overall background level tends to be lower compared with
proportional counter systems, again allowing a clearer view of the Pd peak above the background. This translates into the
ability to measure lower thicknesses of Pd using solid state detectors relative to proportional counters. The disadvantage in
terms of Pd measurement is that solid state detectors are not as efficient as proportional counters in detecting the high energy
Pd K-line x-rays. As such, overall x-ray intensity for the same Pd thickness will be less when using a solid state detector than
a proportional counter, given all other factors being equal. This disadvantage is partially negated by the overall lower back-
ground levels observed with solid state detectors.
Other considerations noted for the proportional counter based XRF systems must be applied as well with solid state detector
based systems. These include corrections for phosphorous content in both the nickel and again, to a lesser extent, the Pd
layer. The advantages offered by the solid state detector when measuring ENEPIG come with other disadvantages, as well.
First, the cost for solid state detector based systems is higher than proportional counter based systems. Second, the size of the
detection area is smaller than proportional counters. As a result, less x-rays are detected per unit time under the same exci-
tation conditions. Generally, larger x-ray collimators must be used to compensate for the smaller detection area. This means
that measurement of sample areas less than 12 mils wide or in diameter can be problematic with solid state detector based
XRFs. Typically longer measurement times must be used to achieve the same level of measurement repeatability as a pro-
portional counter based XRF. However, if collimators that are 20 mils or larger can be used, then measurement time for both
types of XRF’s can be comparable to achieve similar repeatability.
XRF Instruments Using Cr Target X-ray Source Some proportional counter based XRF systems have been provided by at
least one manufacturer using a Cr target x-ray source. The principle advantage of the Cr target source is its ability to excite
the Pd L series peaks (~ 3 keV). Once these peaks are sufficiently excited, measurement precision is significantly improved
for the Pd layer since the sensitivity of Pd L line x-ray intensity, in terms of unit thickness change, is excellent. This high
sensitivity to Pd thickness change is especially advantageous in the working range for immersion Pd thicknesses used in
typical ENEPIG applications. The improved measurement repeatability and shorter measurement times that may be used,
allow for better process control. Furthermore, by shifting the Pd analysis from the high energy K line typically used to the
low energy L line, the issue of background scatter variations from the substrate is eliminated. This is because low energy
scatter will not vary in this case.
Thus the measurement of Pd is less dependent again on operator know-how and vigilance. By using the Cr target source with
a solid state detector, one may have the same advantages the Cr target offers for the Pd layer and achieve the advantages for
the Au layer offered by the solid state detector. Again there is a down side to this strategy as well. Very small areas (<12
mils) are difficult, if not, impractical to measure (at least long measuring times are required). Secondly, Cr target sources
typically do not have as long an operating life as the common W or Mo target sources. Therefore, cost of ownership is
higher.
Vacuum Based XRF Systems Even higher cost XRF systems are available that use only solid state detectors and offer the
ability to evacuate the X-ray chamber of air. By evacuating the X-ray chamber, one gains the ability to directly detect phos-
phorous x-rays. Detection and counting phosphorous x-rays allows for the direct measurement of phosphorous content in
electroless nickel. This provides the user with direct, accurate composition measurement and allows the XRF to simultane-
ously calculate electroless nickel thickness based on the actual phosphorous content. This represents the most accurate way
to measure electroless nickel layers.
The same advantages and disadvantages described above for measurement of Au and Pd layers using solid state detectors
applies with one exception. If one chooses to configure the vacuum XRF with a Cr target source to analyze the Pd L peaks
intensity or alternatively uses x-ray optics to produce microbeams to measure very small sample areas, the use of an evacu-
ated environment reduces background substantially for the Pd L peak. When measuring Pd L intensity in atmosphere, argon
fluorescence interferes with Pd L peaks (Ar is 1% of the atmosphere). By evacuating the sample chamber, this effect is elimi-
nated, making Pd L peak intensity determination more precise.
To summarize the various effects one must address when calibrating and measuring ENEPIG coatings by XRF, and the vari-
ous solutions offered by different XRF configurations, the following Table A4-1 is offered. In addition, the supporting section
to this article includes some example spectra that illustrate some of the effects discussed.
IPC-4556 January 2013
26

Table A4-1 Summary of XRF Configuration Solutions Offered for Measurement
of ENEPIG Plating on PCB’s with Advantages and Disadvantages
ENEPIG
Layer Proportional Counter XRF Solid State Detector XRF Vacuum & Solid State Detector XRF
Au 1. Use peak deconvolution to correct
for Br interference
2. Check calibration at least twice a
day - drift correct or recalibrate as
needed
3. Difficult to measure <51 µm
4. Measure time 60 - 90 sec
depending on collimator size
5. Can measure areas as narrow as
76 µm wide or 102 µm diameters
with longer measurement times
(120 sec)
1. No deconvolution needed - can
measure <25 µm - better overall
accuracy
2. Good long term stability
3. Measure areas <305 µm wide -
impractical unless instrument
configured with x-ray optic
4. Measure time 60 - 90 sec; longer
for layers <25 µm. Less time if
collimator is 508 µm or larger
or if x-ray optic used.
1. No deconvolution needed - can
measure <25 µm - better overall
accuracy
2. Good long term stability
3. Measure areas <305 µm wide -
impractical unless instrument
configured with x-ray optic
4. Measure time 60 - 90 sec; longer
for layers <25 µm. Less time if
collimator is 508 µm or larger
or if x-ray optic used
Pd 1. Must use background correction
methods unless Cr target source
used
2. Measurement of Pd <51 µm is
problematic unless Cr target
source used
1. Must use background correction
methods unless Cr source or x-ray
optics used
2. Measurement of Pd <51 µm is
possible with longer measurement
times
3. Measure areas <305 µm wide
impractical unless instrument
configured with x-ray optic
4. Use of Cr target source or x-ray
optics improves precision, reduces
time
1. Must use background correction
methods unless Cr source or
x-ray optics used
2. Measurement of Pd <51 µm is
possible with longer measurement
times
3. Measure areas <305 µm wide
impractical unless instrument
configured with x-ray optic
4. Use of Cr target source or x-ray
optics improves precision, reduces
time and allows for measurement
of minimum of 7.6 µm
Ni-P Correct thickness measurement for
difference in % P between calibration
Most accurate - measures % P
and corrects thickness of Ni layer
Correct thickness measurement for
difference in % P between calibration
standard and sample
standard and sample
automatically
January 2013 IPC-4556
27
Supporting Section
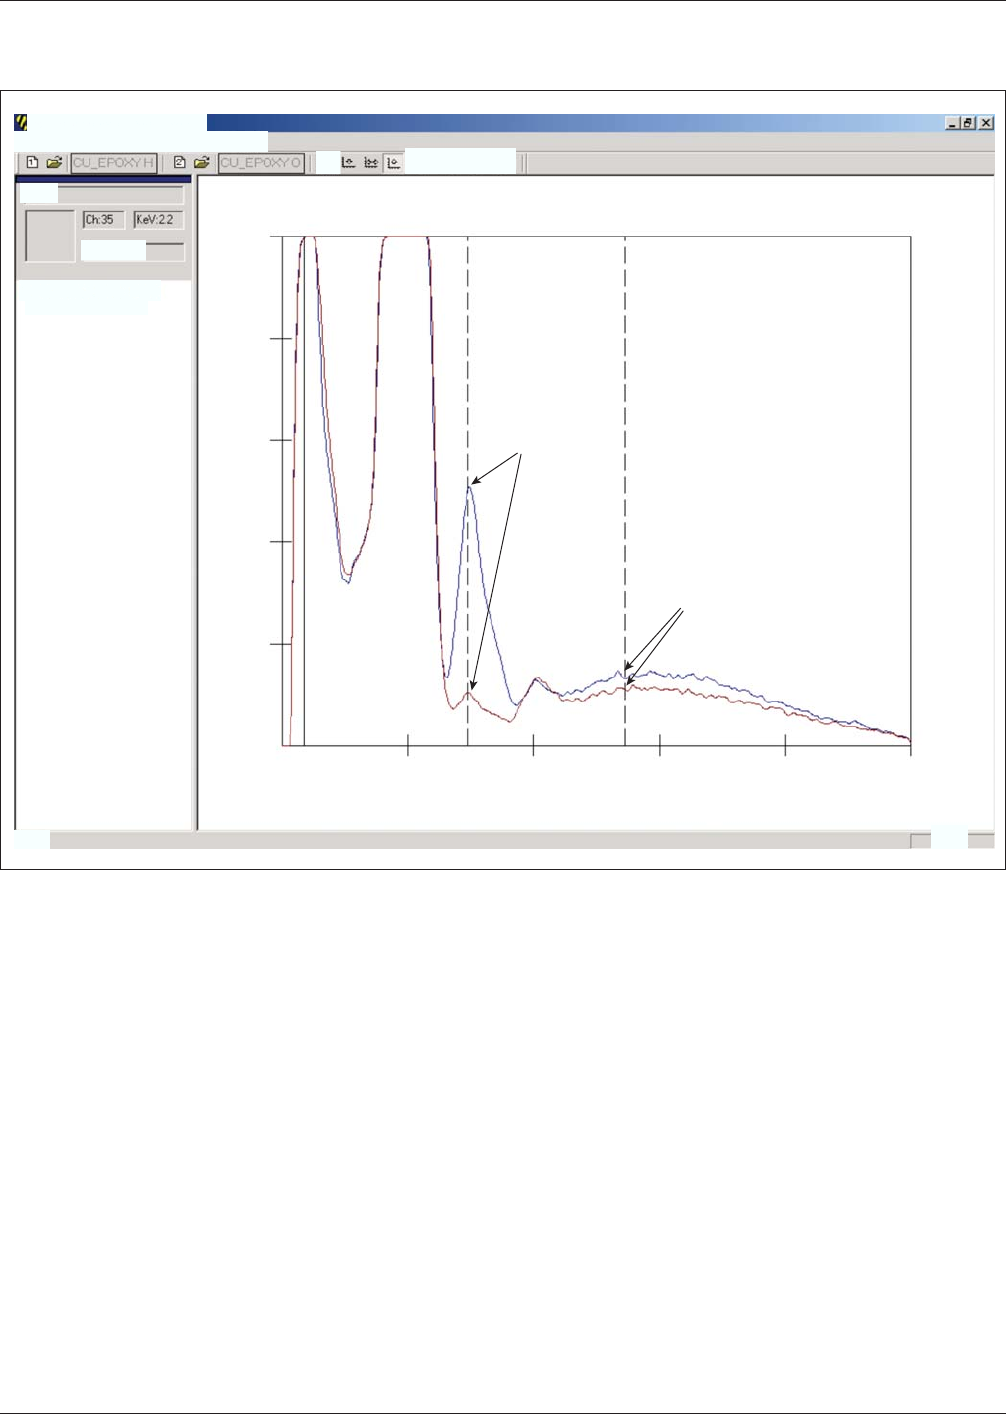
Above Figure A4-SS-1 displays overlay of one spectrum collected on half ounce Cu/epoxy and spectrum of one ounce
Cu/epoxy. Blue trace is from half ounce Cu/epoxy, red trace is from one ounce Cu/epoxy. Note the significant reduction in
Br peak when Cu thickness increases from half ounce to one ounce. Also note the difference in background levels in the
indicated region of the spectrum where Pd intensity will be counted. Again, background ‘‘noise’’ decreases as Cu thickness
increases.
Figure A4-SS1 XRF Spectra of 1/2 oz Cu/Epoxy vs. 1 oz Cu/Epoxy
Smoothed, Comparison of Cu epoxy half ounce.cts(blue) vs. Cu epoxy one ounce.cts(red)
0.9
795
Br Pd
636
477
Br from epoxy
Background noise
in Pd region
318
159
0
8.4 15.8
KeV
Counts
23.3 30.7 38.2
IPC-4556 January 2013
Spectral Analysis Mode- WPHA
28
Fle Edt Yew Display Ogerations ROI Help
BLUE
Dx 2109.2
Peak(Ch.,KeV,Cts)
191,8.0,12548.6
Ready
讼
箱物箱箱着
NM[