IPC-4556 印制板化学镍钯浸金(ENEPIG)规范ENG.pdf - 第39页
Above Figure A4-SS-2 displays spectrum from typical ENEPIG plated Cu sample (no epoxy) and spectrum from one ounce Cu/epoxy (blue trace). Note the Red peak near Br is the Au L- β peak without any Br interference since th…
Supporting Section
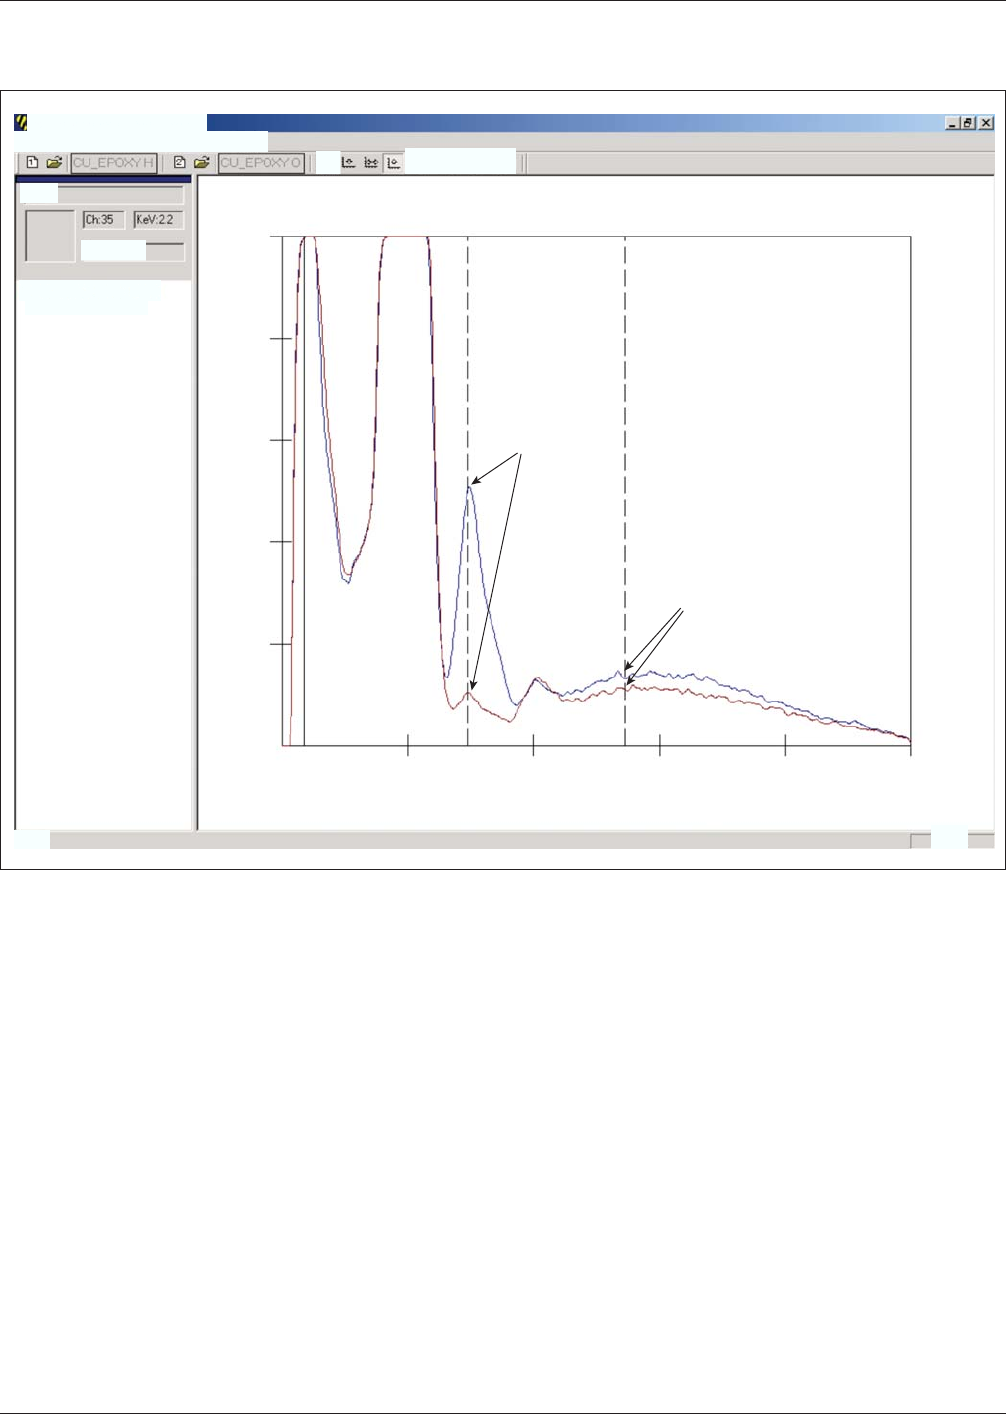
Above Figure A4-SS-1 displays overlay of one spectrum collected on half ounce Cu/epoxy and spectrum of one ounce
Cu/epoxy. Blue trace is from half ounce Cu/epoxy, red trace is from one ounce Cu/epoxy. Note the significant reduction in
Br peak when Cu thickness increases from half ounce to one ounce. Also note the difference in background levels in the
indicated region of the spectrum where Pd intensity will be counted. Again, background ‘‘noise’’ decreases as Cu thickness
increases.
Figure A4-SS1 XRF Spectra of 1/2 oz Cu/Epoxy vs. 1 oz Cu/Epoxy
Smoothed, Comparison of Cu epoxy half ounce.cts(blue) vs. Cu epoxy one ounce.cts(red)
0.9
795
Br Pd
636
477
Br from epoxy
Background noise
in Pd region
318
159
0
8.4 15.8
KeV
Counts
23.3 30.7 38.2
IPC-4556 January 2013
Spectral Analysis Mode- WPHA
28
Fle Edt Yew Display Ogerations ROI Help
BLUE
Dx 2109.2
Peak(Ch.,KeV,Cts)
191,8.0,12548.6
Ready
讼
箱物箱箱着
NM[
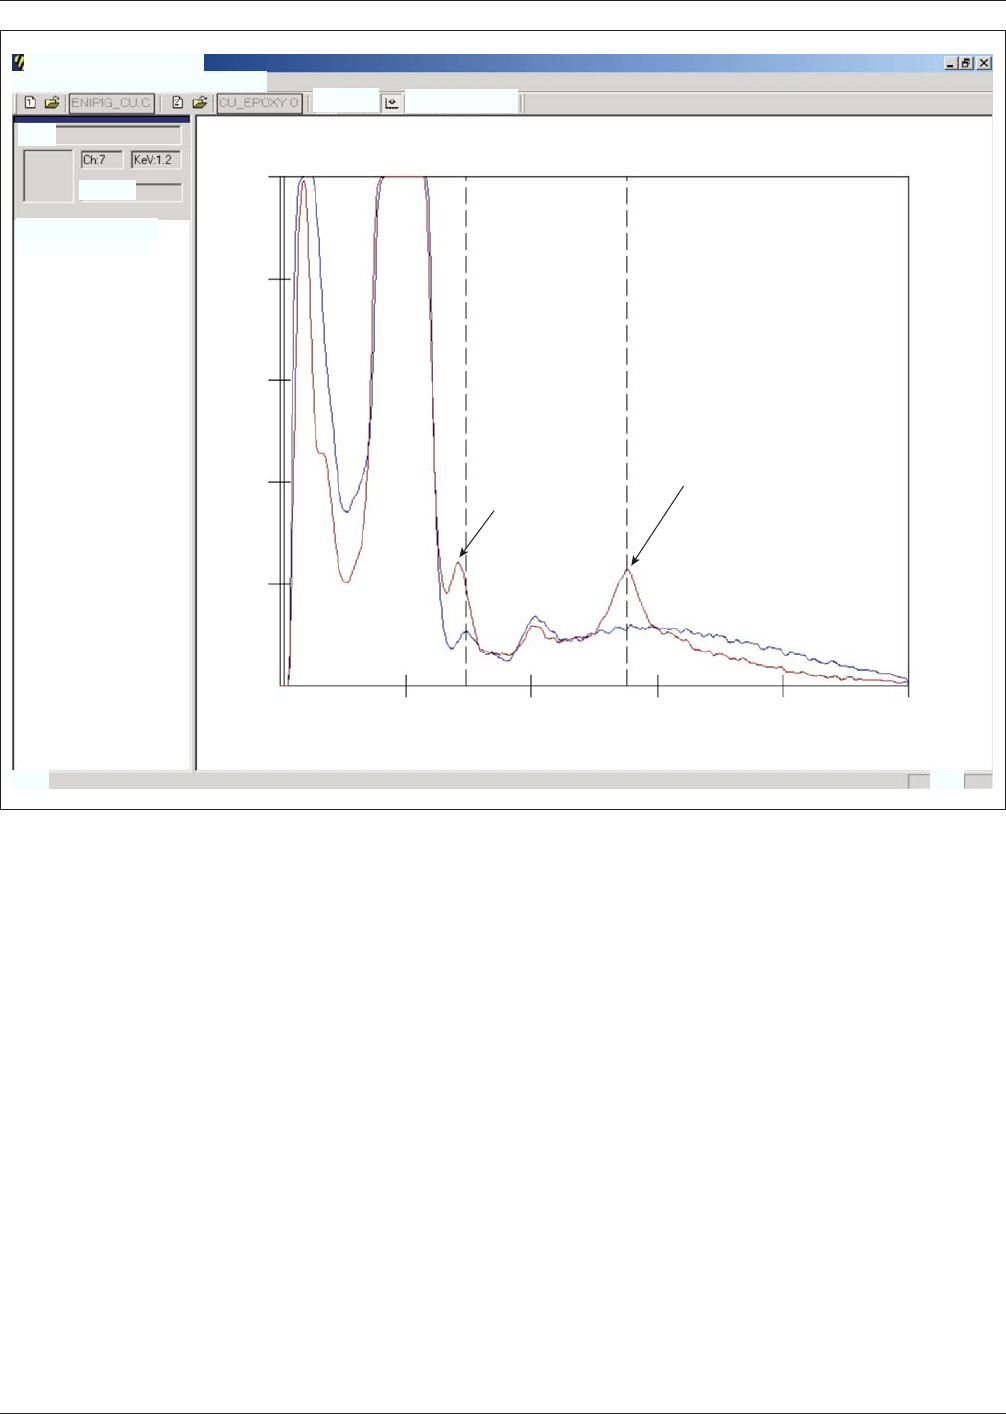
Above Figure A4-SS-2 displays spectrum from typical ENEPIG plated Cu sample (no epoxy) and spectrum from one ounce
Cu/epoxy (blue trace). Note the Red peak near Br is the Au L-β peak without any Br interference since the substrate for this
sample had no epoxy. The figure illustrates how close the energies are between the Au L-β peak and the Br K-α (blue trace,
marked as Br). Without peak deconvolution these peaks would be summed as one peak and erroneously interpreted as
immersion Au thickness.
Figure A4-SS2 XRF Spectra of ENEPIG Plated on Cu (No Epoxy) vs. 1/2 oz Cu/Epoxy
Smoothed, Comparison of Cu epoxy half ounce.cts(blue) vs. ENEPIG Cu.cts(red)
78
0.9
0
Br
Pd
624
468
Combined Au + Br
Pd peak “sits” on top of
background. It’s height
depends on Pd thickness
AND background level
unless background
subtraction is us
(from epoxy)
ed
312
156
0
8.4 15.8
Count
KeV
s
23.330.7 38.2
January 2013 IPC-4556
Spectral Analysis Mode-WPHA
29
Ele Edk Yew Display Operations BOI Help
BLUE
Dts: 00
Peak(Ch.,KeV,Cts)
193,8.1,14893.2
Ready
△
lo bs
简首首当指
INUM
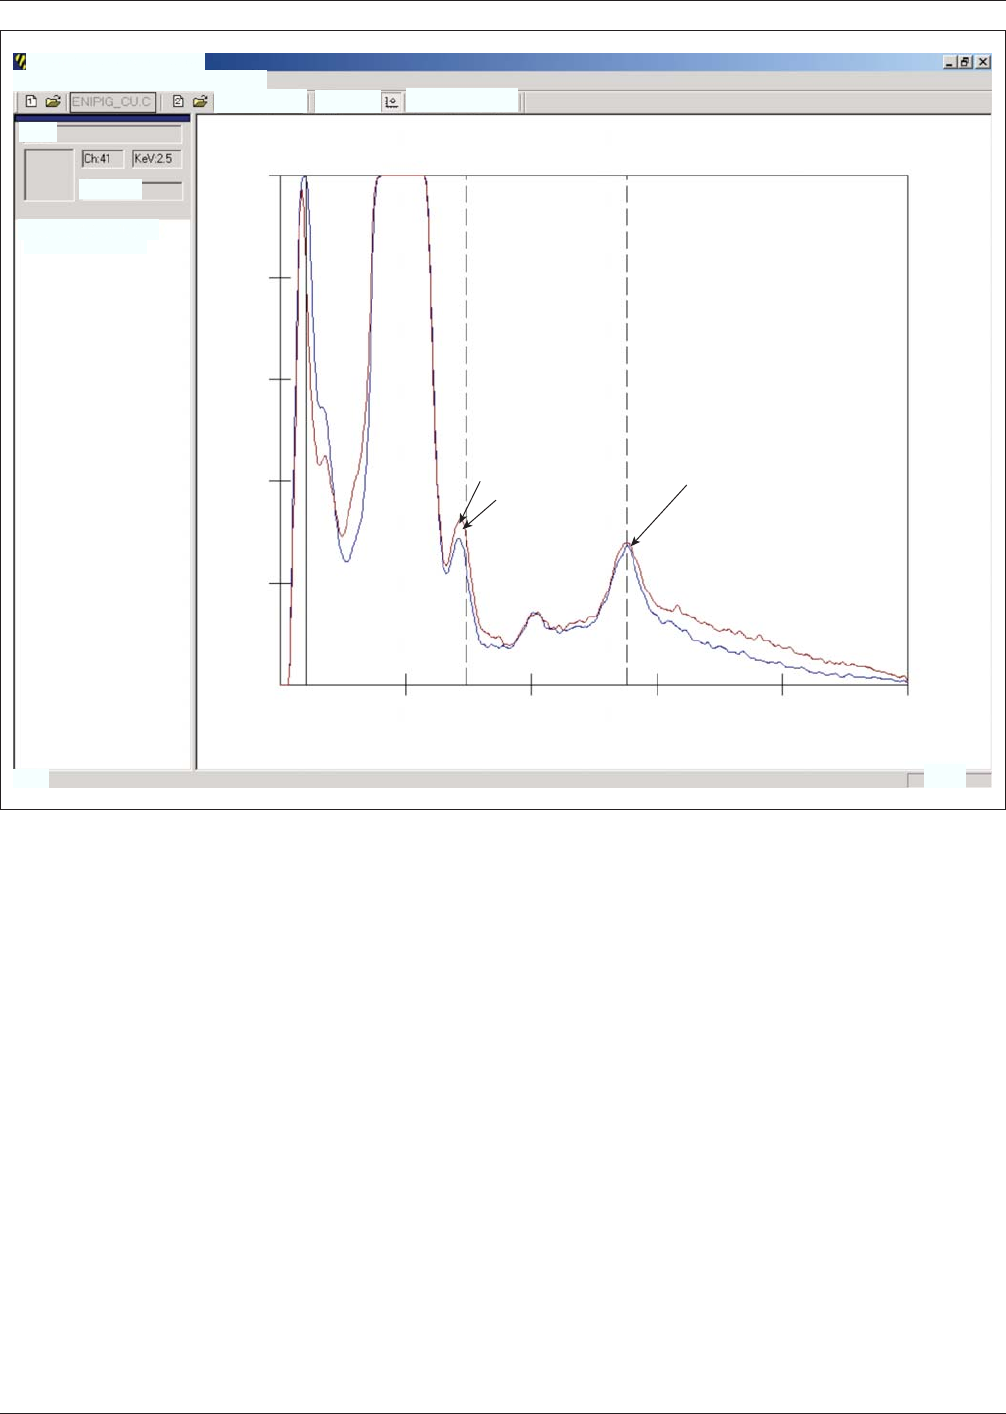
Above Figure A4-SS-3 displays spectrum from typical ENEPIG plated on pure Cu (no epoxy) and typical ENEPIG plated
on one ounce Cu/epoxy (red trace). In the case of ENEPIG on one ounce Cu, the Br peak is added to the Au peak (seen in
blue with no Br interference). The red peak (Br + Au) is higher which results in a higher thickness measurement if peak
deconvolution is not used. Also note the Pd peak. The red Pd peak from the once ounce Cu sample is slightly higher than
the blue Pd peak because the background level scattered from the epoxy base raises the Pd peak a bit higher. Again with-
out correction or proper calibration, this would be interpreted as slightly higher Pd thickness. Both effects will vary as the
Cu thickness varies. Also x-ray beam size and position on the sample relative to its edges can affect the level of these inter-
ferences.
Figure A4-SS3 XRF Spectra of ENEPIG Plated on Cu (No Epoxy) vs. ENEPIG Plated on 1 oz Cu/Epoxy
Smoothed, Comparison of ENEPIG Cu.cts(blue) vs.ENEPIG one ounce Cu.sts(red)
0.9
655
Br
Pd
524
393
No Br in blue
trace. Au + Br
in red trace
~ 4 mi Pd peak with
different background noise
262
131
0
8.4 15.8
Count
KeV
s
23.330.7 38.2
IPC-4556 January 2013
Spectral Analysis Mode- WPHA
30
Ele Edt Yew Display Ogerations ROI Help
ENIPIG_102C]
认 Dl
BLUE
Chs 854.5
Peak(Ch.,KeV,Cts)
191,8.0,12560.2
Ready
箱笛笛萄简
NUM[